Education / NEoWave Explained / What is NEoWave analysis?
What is NEoWave analysis?
An interview with Glenn Neely, author and financial analyst
NEoWave customers often ask Glenn Neely, author of Mastering Elliott Wave,
"What is NEoWave analysis?" Glenn Neely took time out of his busy schedule to discuss the
difference between NEoWave and the original, orthodox Elliott Wave.
He summed up his thoughts by saying, "NEoWave makes things a lot clearer. It allows for far greater certainty, confidence, clarity, and precision of timing.
And it eliminates alternate scenarios." Here is Glenn Neely's answer to this popular question.
What is NEoWave analysis? In general, NEoWave is a more logical, objective, scientific, step-by-step process for Wave analysis.
I have added lots of additional rules to the original structure, which I call
orthodox Elliott Wave.
NEoWave doesn't change orthodox Elliott Wave.
It's similar to how algebra and trigonometry don't change arithmetic, they just add a great deal to the foundation.
It allows you to do more complex problem solving.
NEoWave allows you to address more complicated Wave analysis situations – to be able to predict with more timing precision, more price precision, and more trading precision. So that's what NEoWave is about. It's adding onto the original orthodox Elliott Wave Theory to make it much more scientific, much more useful, much more objective, and much more accurate.
As far as HOW NEoWave analysis is done, I will step through my book, Mastering Elliott Wave, chapter by chapter, with a brief synopsis.
Chapter 1 is a survey and review of Elliott Wave and what I later called NEoWave. Watch Glenn Neely explain Chapter 1
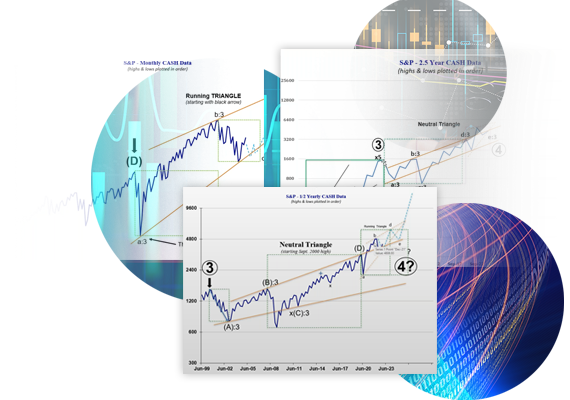
Chapter 2 is where the actual application of Wave Theory begins. It talks about: What is a "Wave"? I've always found it quite fascinating that – until my book came out – no one had ever described the actual term of a Wave. It's pretty preposterous but true! That's why, in my book, I describe very specifically, very objectively exactly what a Wave is, so you can then build the foundation of an entire theory on top of it. Chapter 2 also explains how to categorize different types of Waves, how you label them, how you plot the data. This provides your initial foundation.
Now you've set up your charts, you done it correctly, you used the right data (which has to be cash data), and you've plotted the highs and lows in order. Now you can move on to what I call the preliminary analysis. That's in Chapter 3.
Chapter 3 explains how to identify which points are important on your charts. You start to use concepts of proportionality and using retracement rules to decide if certain moves are more likely impulsive with the trend or corrective against the trend. You can start piecing together independent Waves into clusters of patterns. For example, you can identify a five-Wave move, which is an impulsive trend, or a three-Wave move, which is a correction.
Chapter 4 explains how to make sure the Waves you're looking at follow a concept of degree. You don't want to have a Wave that you say is a primary degree taking 5 years and 500 points, and saying that's the same thing as another Wave that takes 5 days and 5 points. They are completely different degrees. So Chapter 4 describes the degree concept to make sure you're comparing like with like. You're not comparing apples to oranges; you're comparing oranges to oranges.
Essentially, the entire Chapter 5 is where all orthodox Elliott Wave books start AND end. It talks about impulsive patterns, corrective patterns, what they look like, how they channel Fibonacci relationships, things like that. So my book takes care of all that just in Chapter 5. And there's 12 chapters to my book.
Chapter 6 goes into the confirmation of what you believe was, for example, a five-Wave move or a correction. It specifically describes post-pattern behavior, what you need to see after a pattern is finished, the kinds of up or down movement, how fast it needs to be, how long it should take, how simple or complicated it should be. With confirmation, you can say, "Well, yes, I analyzed that correctly." The market is sort of "grading your homework." It's not just your opinion. You have some kind of confirmation or proof that your Wave analysis was correct.
Chapter 7 moves on to the next phase, which is the compaction process. For example: "This whole five-Wave move can be compacted to just Wave 1 or Wave A of an even bigger five-Wave move or even bigger correction." So Chapter 7 discusses how to go about doing this.
Chapter 8 deals with much more complicated patterns. For example, sometimes you get two flats that are connected with an intervening X Wave. It tells you what they should look like, how they should channel, and what kind of relationships you should have for this.
Chapter 9 goes on to discuss even more minutiae and Wave behavior: structuring patterns, time rules, touch points for channeling, and so forth.
Chapter 10 moves on to really complicated formation and what should happen after these patterns take place, if the pattern is really strong, or if it's really weak, what that means and how to incorporate this information into your analysis.
Chapter 11 goes into very specific details of every segment of a five-Wave move, what Wave 1 should do if it's the longest or if it's not the longest. What Wave 3 should do if it's the longest or not the longest. Wave 5, same thing. It also goes into patterns called terminals. A terminal is the last Wave of a large trend. It indicates a very violent reversal. Chapter 11 also presents detailed discussions on corrections, such as flats and zigzags.
Chapter 12 is probably the most advanced chapter. It talks about channeling of patterns and what they should look like with variational possibilities. It talks about Fibonacci relationships, concepts that are called missing Waves, and patterns that might look like other patterns and why they might be mimicking other patterns but aren't.
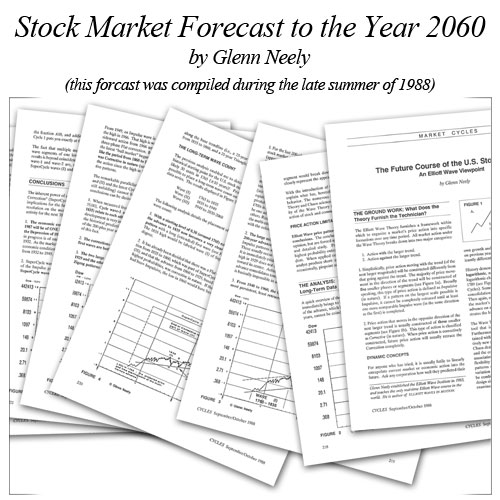
The very last section of Mastering Elliott Wave is an Appendix – a prediction I wrote and initially published in 1988. I predicted the next 75 years of stock market action.
So that's basically an overview of my book, with all these steps that are involved in doing NEoWave analysis – and what makes NEoWave analysis different from orthodox Elliott Wave.
Interviewer: Mr. Neely, you have mentioned that one of the challenges with orthodox Elliott Wave is that people will produce contradictory bearish and bullish scenarios. How does NEoWave make sure that doesn't happen?
NEoWave has dozens, if not hundreds, of additional rules on how patterns should behave. Perhaps one of the most important parts of my entire book is presented in the last two pages: the Expansion of Possibilities. This involves what I call the Rule of Reverse Logic.
I've heard of some people having three or four or five different Wave count scenarios – some bullish, some bearish. NEoWave tells you what to do in those situations, how to get rid of the extraneous counts that aren't going to apply to the current situation and how to narrow it down to the one that does.
The bottom line of the matter is that the more counts you have, the closer you are to the middle of the pattern. So if you have one pattern that indicates you're finishing Wave 5, one pattern that indicates you're finishing Wave 4, one that indicates you're finishing Wave 3, one that indicates you're in the B Wave, one that's bullish, and one that's bearish – you can go through all these scenarios – the one that's going to be correct is the one that produces the most boring, least exciting scenario! It's the Wave count that indicates you're in the dead center of the most patterns possible.
The middle of a pattern is Wave B, the middle of a five-Wave move is Wave 3. You could be in Wave 3 of Wave 3 of Wave 3 or in Wave B of Wave B of Wave B. So the deeper you are in the middle of many patterns, the more likely that this is the correct count, which just means you're going to get the least exciting future outcome for a while.
So the more scenarios you have, the closer you are to the middle. Get rid of all the counts that indicate you're at the top or the bottom, and only keep those that indicate you're in the middle of a trend. And that will usually leave you with one count.
Interviewer: This discussion will help Elliott Wave enthusiasts better understand the difference between orthodox Elliott Wave and NEoWave. For those who embrace NEoWave, what benefits will they get? Why should they step out of one world and step into the next world?
That's a really good question. NEoWave will help you to better define price targets and time targets. It will help you get rid of alternate scenarios and reduce confusion. If you're a trader and you're using orthodox Elliott Wave, it often allows for multiple scenarios and lots of different possibilities. If you don't know which one to choose, that makes it very difficult to trade.
With NEoWave, you can almost always get down to one count, so you know which one you're supposed to be paying attention to, which helps with trading. NEoWave teaches patience, because it gives very specific price time parameters for patterns. If you just finished Wave 3 and it took 10 days, then you know Wave 4 is going take at least 10 days. So for the next 10 days, you don't have to worry about Wave 4 finishing. Orthodox Elliott Wave has none of these rules, so you never know what's going on, and you're always guessing about all kinds of things.
With NEoWave, the dramatic increase in rules reduces the confusion – it reduces the uncertainty and nervousness you get when you have multiple counts and you don't know which one to pick.
NEoWave makes things a lot clearer. That's really the bottom line. It allows for far greater certainty, confidence, clarity, and precision of timing. It eliminates alternate scenarios. Plus, increased accuracy with your Wave counts will dramatically improve your trading.