Bolster Your Elliott Wave trading and forecasting with this FREE webinar

"How Accurate Wave Analysis Is Really Done"
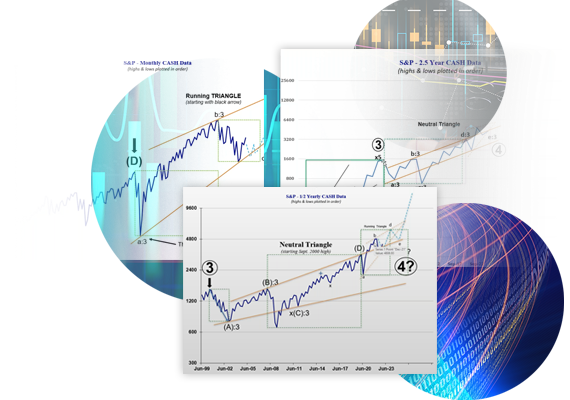
Here's your chance to learn Glenn Neely's 5-Step Wave Forecasting Process.

Get in-depth advice as Glenn Neely walks you through his 5-step NEoWave process to produce wave counts that yield reliable forecasts. This is a must-watch video to improve your Wave Theory analysis and forecasts!

Sign up now to get this FREE webinar!

*No purchase obligation. We do not sell or share our mailing list.

FREE NEoWave Webinar

Don't miss this opportunity!
This educational tool is available for a limited time.

In this webinar, Glenn Neely explains that the rules he covers will substantially improve your ability to integrate advanced NEoWave concepts into real-time market conditions. This will enable you to achieve far better results than are possible with orthodox Elliott Wave theory.

Here are just some of the key points you'll learn:

  • USE CASH DATA: Find a reliable cash data source that provides the order of highs and lows on a daily basis.
  • CREATE WAVE CHARTS: Plot cash highs and lows (in the order they occurred in real time) on daily, weekly, and monthly charts (and 1/2-yearly, if possible).
  • CONTROL THE COMPLEXITY: Control complexity on ALL charts to no less than 13 monowaves and no more than 55. The ideal number is between 21 and 34.
  • SELECT A STARTING POINT: Find the largest, most violent monowave (or move) on the largest timeframe and mark it as the Extended Wave of the MAIN Trend.
  • INTEGRATE COUNTS DOWNWARD: First, finalize the structure based on the largest timeframe and then force the best count onto the next lower timeframe until you reach the daily timeframe.

SIGN UP NOW
to get this FREE educational webinar!

"How Accurate Wave Analysis Is Really Done"

Don't miss this opportunity to improve your Wave Theory analysis and forecasting!

*No purchase obligation. We do not sell or share our mailing list.