NEoWave Blog
5/6/2025 - NEoWave Staff
NEoWave Accurately Predicted 2025 Market Top, Collapse, and Recovery - With Chart-Based Proof
NEoWave Editor / 5 Minute Read
In early January 2025, Glenn Neely–founder of NEoWave and a leading authority on advanced Elliott Wave analysis–released a critical forecast to subscribers. The warning was clear: the S&P 500 was forming a major top and was on the verge of an accelerated collapse.
Over the following months, the market followed his projection with astonishing precision. Below, we walk through three key charts that prove the power of NEoWave forecasting–and how you can learn to apply this method yourself.
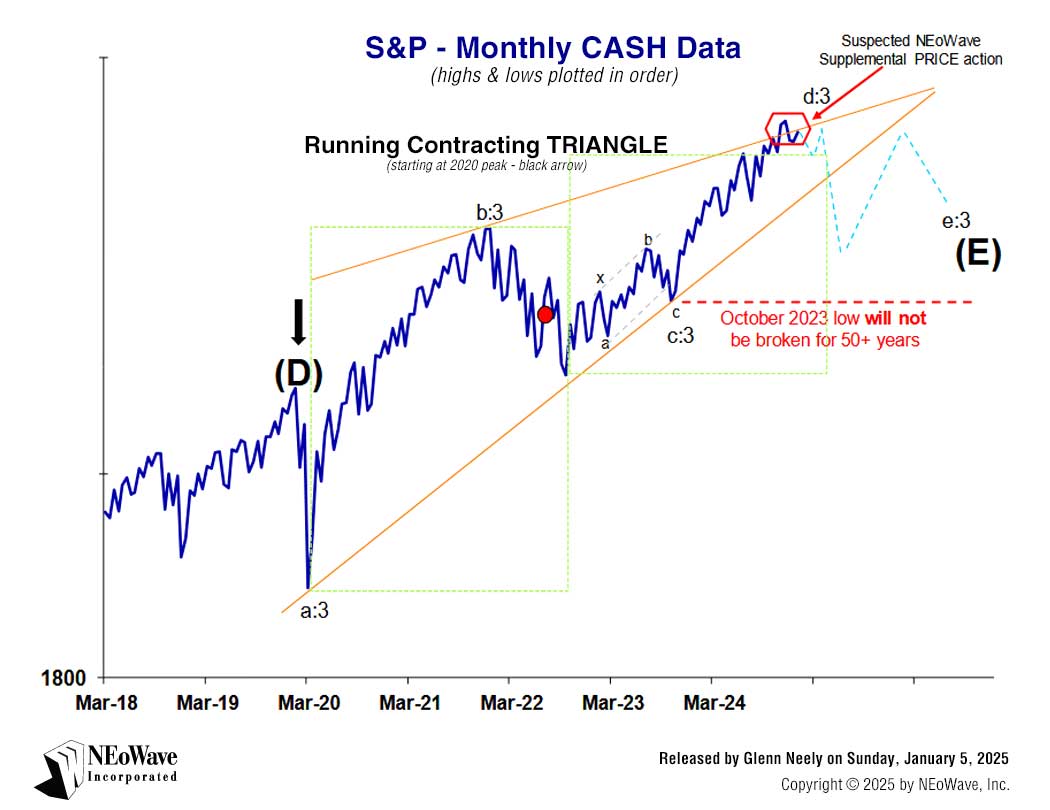
Chart 1: January Forecast Warns of Imminent Collapse
Chart 1 – NEoWave Forecast issued in early January 2025, highlighting a pending market top and accelerated collapse.
NEoWave FORECASTING on S&P 500 - Released by Glenn Neely on Sunday, January 5, 2025.
In this first chart, released in early January 2025, Mr. Neely used NEoWave’s advanced wave structure analysis to identify a dangerous topping formation in the S&P 500. He forecasted not only that the market was near a peak–but that a rapid and significant decline was imminent.
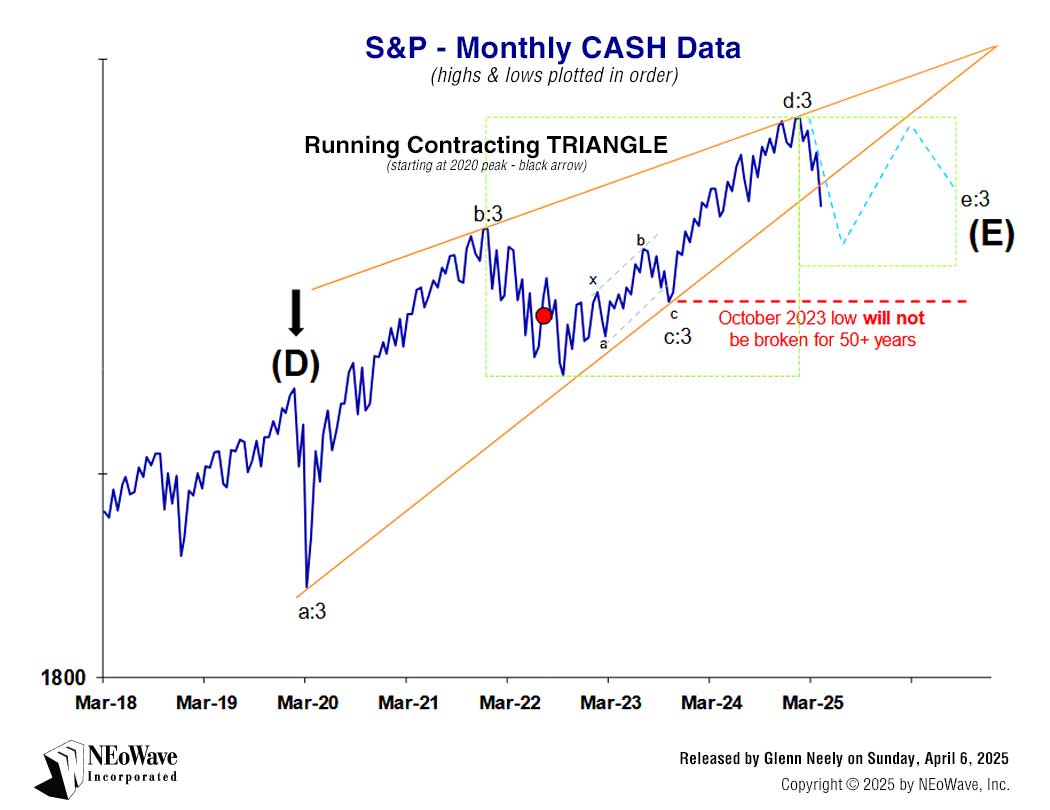
Chart 2: February–March Collapse Follows Forecast Path
Chart 2 – One month later, the S&P 500 topped and collapsed almost exactly as predicted.
NEoWave FORECASTING on S&P 500 - Released by Glenn Neely on Sunday, April 6, 2025.
By mid-February 2025, the S&P ended its multi-year bull run and began a sharp decline, collapsing through February and March. The timing, scale, and structure of this move aligned almost perfectly with NEoWave’s blue-dashed projection line, reinforcing the power of objective, rule-based forecasting.
Chart 3: The Predicted Bottom – and the Start of a Rally
Chart 3 – This updated NEoWave chart shows the S&P nearing the projected bottom zone and beginning a rally.
NEoWave FORECASTING on S&P 500 - Released by Glenn Neely on Sunday, May 4, 2025.
In early May 2025, Glenn Neely published an updated S&P chart showing the index nearing the exact bottom zone forecasted months ago. Even more compelling, the S&P has already started a substantial rally, once again tracking the blue-dashed forecast path almost exactly.
Why NEoWave Outperforms Traditional Analysis
These three charts demonstrate something rare in financial markets: reliable, rule-based precision. Orthodox Elliott Wave theory, like most market analysis tools, leaves too much room for subjectivity and revision. NEoWave, by contrast, applies strict logic, pattern clarity, and real-time structural validation to achieve consistent forecasting accuracy.
As these examples show, NEoWave doesn’t just “interpret” past market action–it anticipates future moves with clarity.
Want to Forecast Markets Like This? Learn NEoWave.
If you’re serious about improving your market analysis skills, consider enrolling in our Advanced WAVE Analysis course. This in-depth program teaches you how to apply NEoWave’s proven methodology to forecast market tops, bottoms, and trends with confidence and precision.
Ready to master the next level of market forecasting?
Explore the NEoWave Course →
NEoWave's ADVANCED WAVE ANALYSIS COURSE:
Learn to accurately predict markets in real time with Glenn Neely.
If you want to improve your forecasts, this is the best time in decades to learn Elliott Wave and NEoWave concepts in real-time. Take advantage of this exciting forecasting environment!
To learn more about NEoWave's Advanced Wave Analysis course, personally taught by Glenn Neely...
CLICK HERE
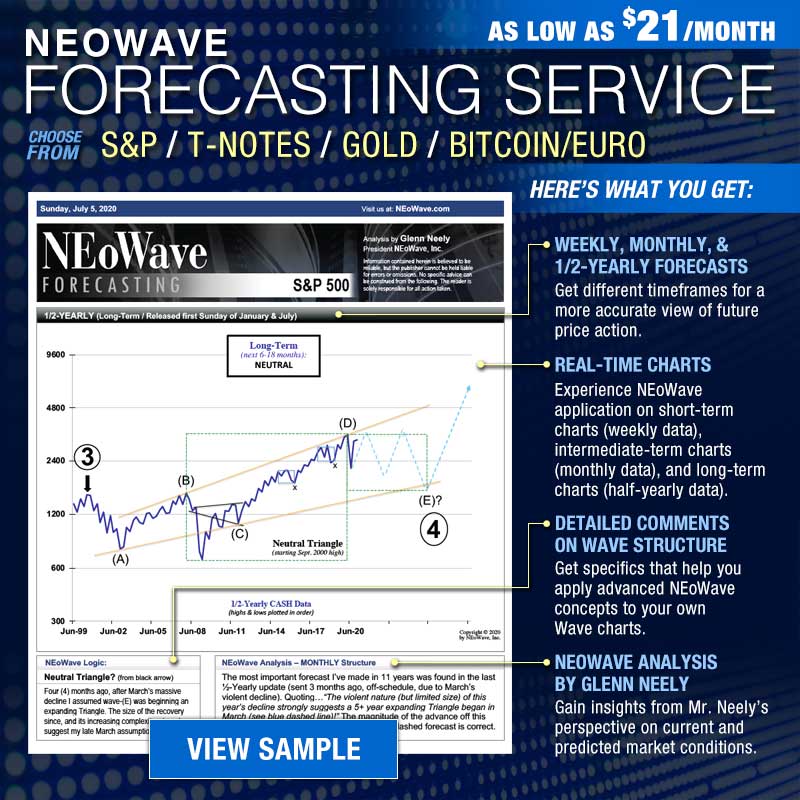
NEoWave's FORECASTING SERVICE:
Learn how to apply advanced NEoWave concepts with Glenn Neely's charts.
With this educational service, you will experience the application of NEoWave to short-term, intermediate-term, and long-term charts for the S&P, Gold, T-Notes or Bitcoin/Euro. You'll receive Weekly, Monthly, & 1/2-Yearly Forecasts as well as NEoWave Analysis by Glenn Neely!
To subscribe to Glenn Neely's NEoWave Forecasting Service...
CLICK HERE
Connect with Glenn Neely:
https://www.facebook.com/NEoWaveGlennNeely
https://www.linkedin.com/in/glenn-neely
Follow us @NEoWaveTheory:
https://www.facebook.com/NEoWaveTheory
https://twitter.com/NEoWaveTheory
https://www.linkedin.com/company/neowave-inc