Patrice R.B. / NEoWave Editor / 5 Minute Read
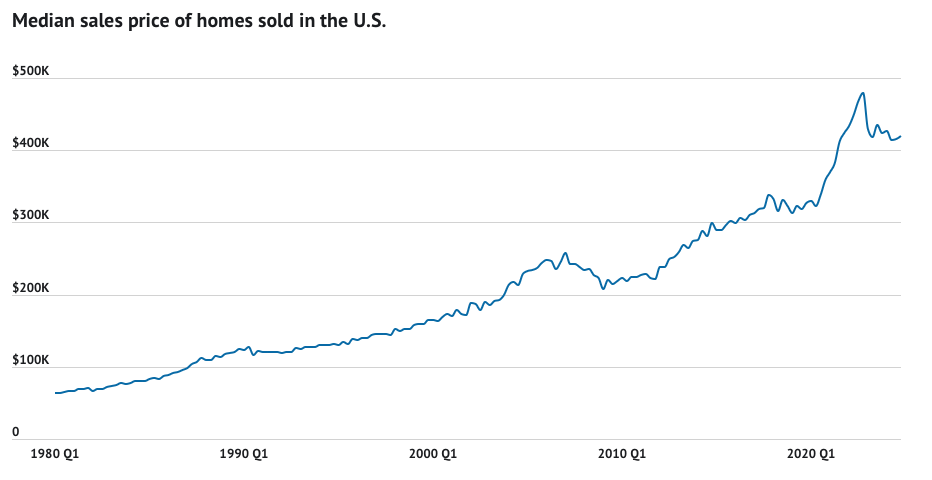
On October 10, 2023, Glenn Neely published a public notice, warning NEoWave customers that the median US home price would be going sideways and down for a long time. He shared a chart that he had created using data from the Federal Reserve, which shows median home prices in the US from 1980 to present. This updated chart is below. Take note of the top right portion of the chart. It shows that the October 2023 price collapse was the largest and fastest in US history!
Despite inflation in many other categories, the updated chart shows that home prices continue to drift lower. It appears another sharp decline in prices will occur in the next year or less. Under NEoWave theory, that tells us a new, prolonged bear market has begun in the US real estate market, which should push median home prices below $275,00, within the next 5-10 years (possibly sooner)!
If you want to improve your forecasts, this is the best time in decades to learn Elliott Wave and NEoWave concepts in real-time. Take advantage of this exciting forecasting environment!
To learn more about NEoWave's Advanced Wave Analysis course, personally taught by Glenn Neely...
With this educational service, you will experience the application of NEoWave to short-term, intermediate-term, and long-term charts for the S&P, Gold, T-Notes or Bitcoin/Euro. You'll receive Weekly, Monthly, & 1/2-Yearly Forecasts as well as NEoWave Analysis by Glenn Neely!
To subscribe to Glenn Neely's NEoWave Forecasting Service...