From the desk of NEoWave founder and trading advisor, Glenn Neely
Forecasting Getting Better Every Month!

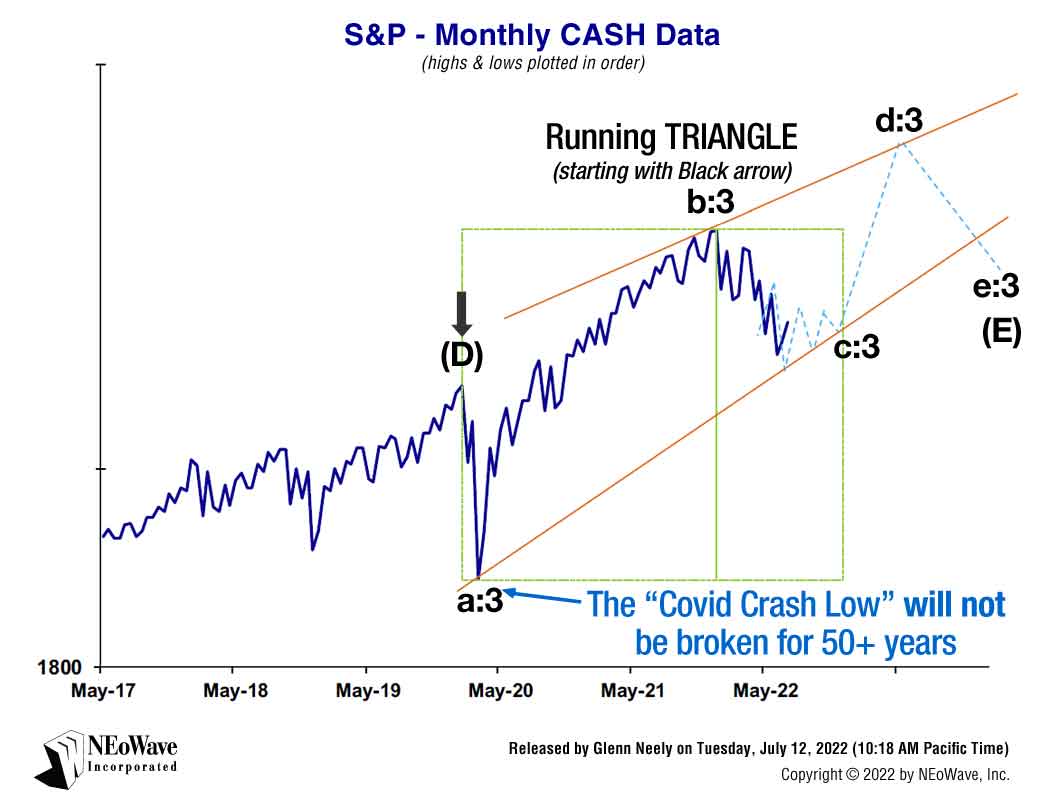
See the "Covid Crash Low" on the chart indicated by the blue arrow.
This NEoWave forecasting chart was released on July 12, 2022
The S&P had finally begun the last leg of the correction, which began in March of 2000
The last leg of any Wave pattern is the easiest to predict. So, when Covid struck in early 2020, the violent decline it created in the U.S. stock market confirmed the S&P had finally begun the last leg of the correction, which began in March of 2000.
In the year 2000, I warned customers forecasting with Wave theory would become increasingly difficult for the next 10-15 years (as the U.S. stock market moved toward the center of the 30 year correction). With that 30 year correction just a few years from ending, market predictability has been improving substantially ALL YEAR and should CONTINUE into the end of this decade!
If you want to improve your forecasts, this is THE BEST TIME in 40 YEARS to learn Elliott and NEoWave concepts in real-time!
Take my next NEoWave Forecasting Course
Enroll in the Advanced Wave Analysis course to learn how to create your own specific, real-time price/time forecasts! The course is 12 weeks live online and gives students a step-by-step, real-time Wave analysis training using Elliott Wave and advanced NEoWave.
To learn more, visit: https://www.neowave.com/AWA-COURSE
Sincerely,
Glenn Neely
NEoWave, Inc.
www.NEoWave.com


