NEoWave Blog
8/7/2024 - NEoWave Staff
Using NEoWave to Forecast S&P 500 with Extreme Accuracy
Patrice R.B. / NEoWave Editor / 2 Minute Read
NEOWAVE FORECASTING WITH PINPOINT ACCURACY:
Glenn Neely's extremely accurate forecast for the S&P 500
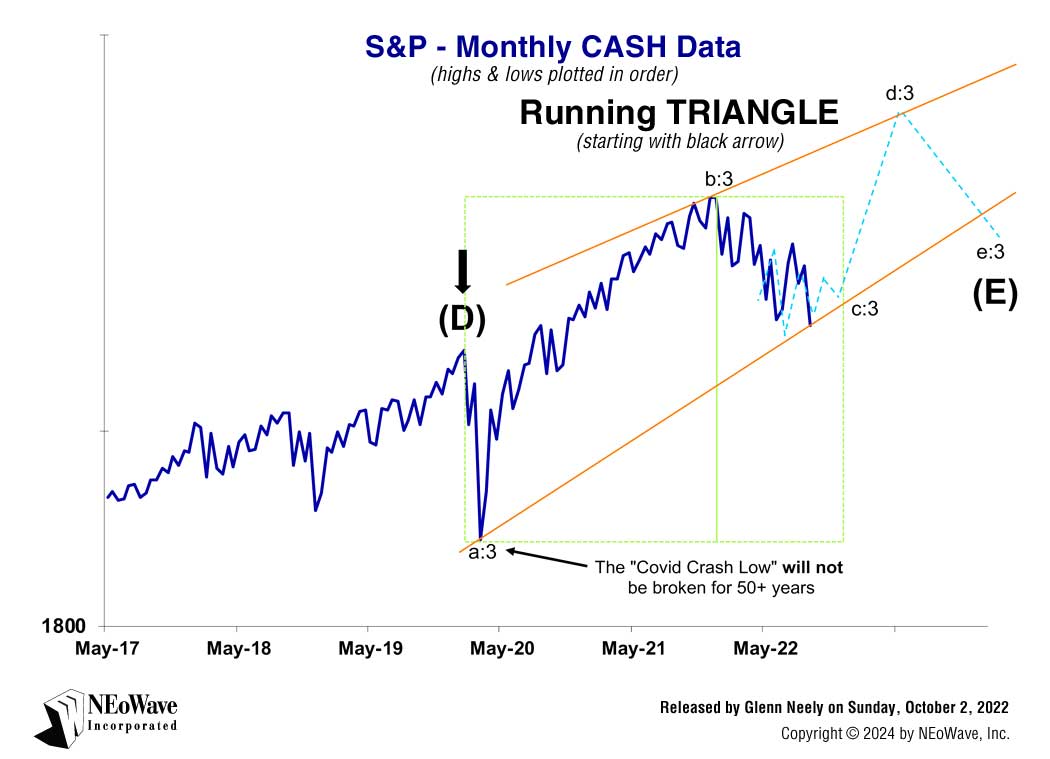
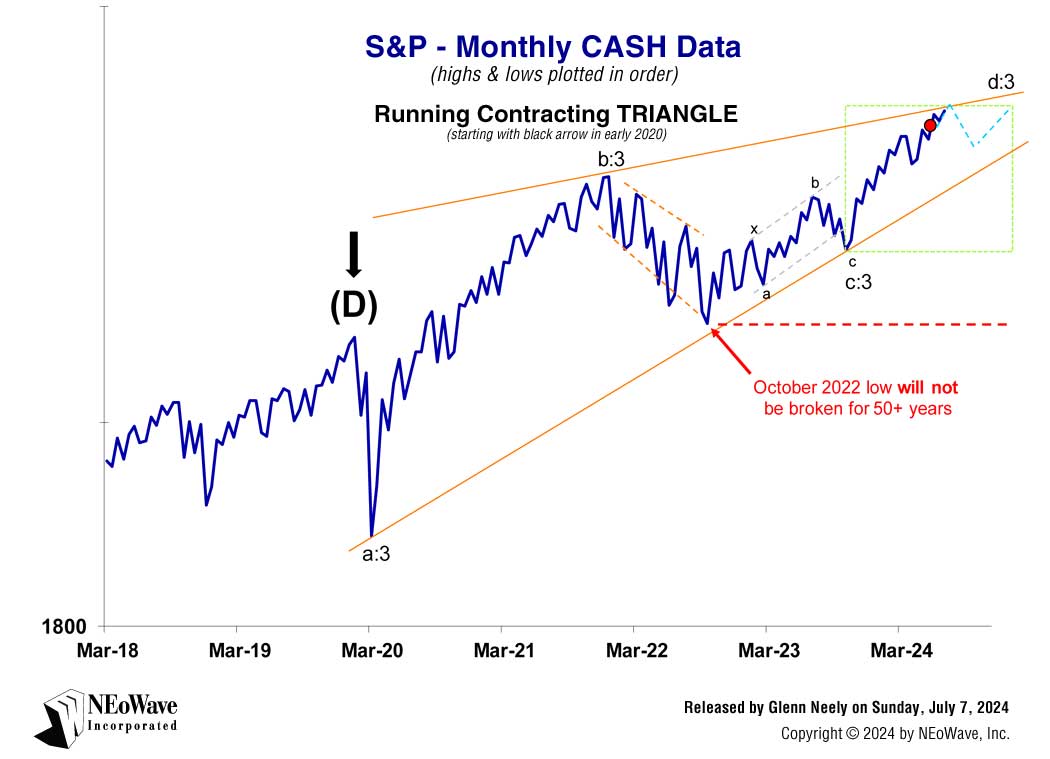
In Glenn Neely's October 2022 market call, he called for a 2-year bull market up to about 5600 in the S&P 500. (See SNP Chart 1 from October 2, 2022 & Chart 2 from July 7, 2024)
Nearly 2 years later – as predicted – the S&P peaked at 5669.67 on July 16, 2024.
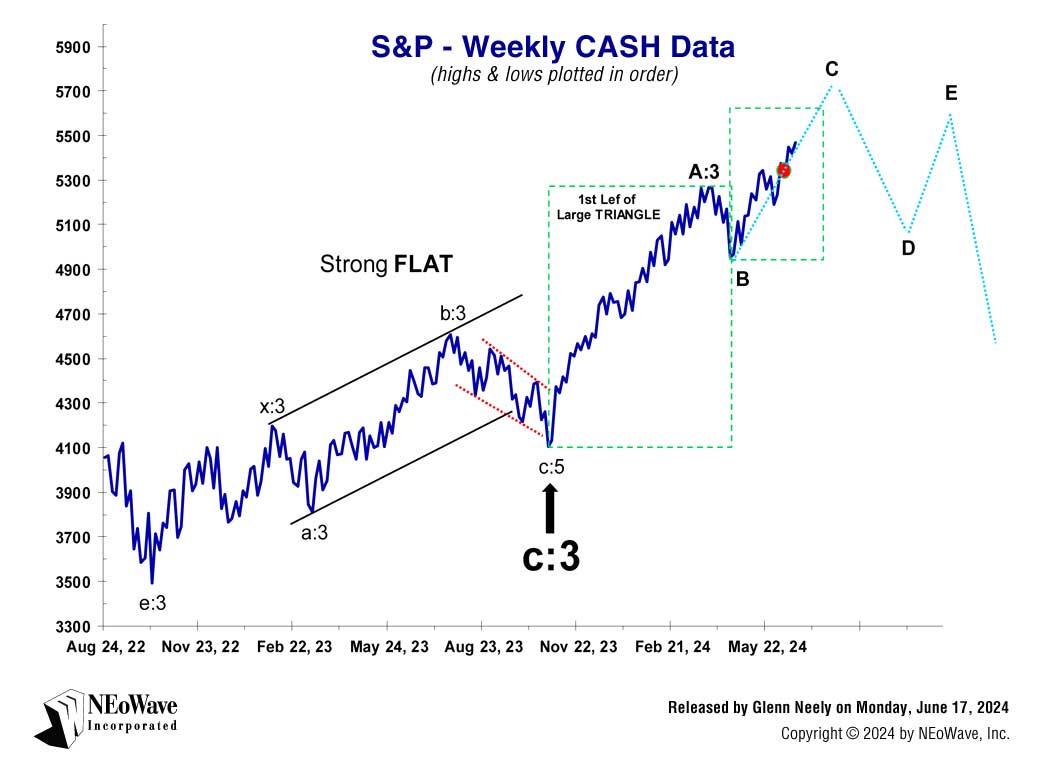
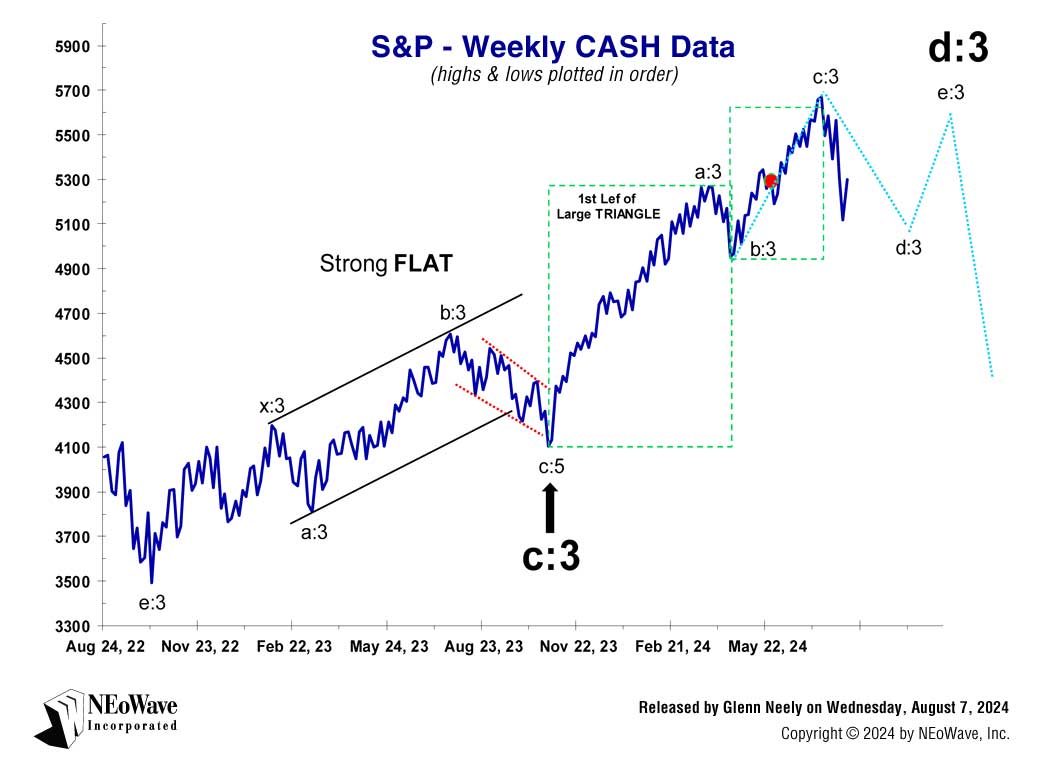
Into last month's high, he started warning subscribers of the NEoWave S&P Forecasting service that a TOP was forming, and it could be the high of the year – and maybe the next few years! (See SNP Chart 3 from June 17, 2024 & Chart 4 from August 7, 2024)
This pinpoint accuracy is a clear example – using real market forecasting charts from the last two years – to show how Glenn Neely's NEoWave forecasting works better in real market environments. On all of the S&P 500 forecasting charts, Mr. Neely employs his unique NEoWave Logic and discovery of new patterns (such as Diametrics and Symmetricals) and new pattern variations (such as reverse alternation). By building on Ralph Nelson Elliott’s original work, Mr. Neely has made NEoWave (advanced Elliott Wave) a significantly better tool to achieve accurate wave analysis and accurate forecasting.
-
Neely, Glenn, 2024, August 7. NEoWave FORECASTING S&P 500 Weekly CASH Data, NEoWave FORECASTING
-
Neely, Glenn, 2024, July 7. NEoWave FORECASTING S&P 500 Monthly CASH Data, NEoWave FORECASTING
-
Neely, Glenn, 2024, June 17. NEoWave FORECASTING S&P 500 Weekly CASH Data, NEoWave FORECASTING
-
Neely, Glenn, 2022, October 2. NEoWave FORECASTING S&P 500 Monthly CASH Data, NEoWave FORECASTING
CHART 1
Released Sunday, October 2, 2022
NEoWave FORECASTING on S&P 500
Released by Glenn Neely on Sunday, October 2, 2022.
NEoWave Logic:
Contracting Triangle (from black arrow)
For months, the S&P has been closely following the blue-dashed projection line. That accurate forecast was determined by employing the NEoWave Rule of Reverse Logic, which tells us to pick the wave count closest to the center when multiple scenarios are possible.
NEoWave Analysis - WEEKLY Structure
Last week, June's low was broken by a small amount. That event creates potential for wave-c to be part of a Flat (instead of the above contracting Triangle), which means a Terminal impulse decline began at this year's high. If so, a final, scary shakeout is due late this year! Either eay, a bounce is due the next few weeks. By late October, we should be able to dtermine which c-wave scenario will unfold.
For the latest NEoWave Forecasting on S&P 500 SUBSCRIBE TODAY
CHART 2
Released Sunday, July 7, 2024
NEoWave FORECASTING on S&P 500
Released by Glenn Neely on Sunday, July 7, 2024.
NEoWave Logic:
Contracting Triangle (from black arrow)
Adding 61.8% of wave-b to the October 22 low gets us approx.. 5600 (the S&P peaked 30 points below that last week). With limited price potential but plenty of time remaining, I expect the S&P will violently gyrate the rest of 2024.
NEoWave Analysis - WEEKLY Structure
Last month, I projected "The ideal upside target still appears to be around 5600 in the cash S&P." The S&P is so close to that level now that any large correction could produce the highest price for wave-d but I don't expect wave-d to end until later this year (close to the election). Once the election is over, the S&P could drop substantially.
For the latest NEoWave Forecasting on S&P 500 SUBSCRIBE TODAY
CHART 3
Released Monday, June 17, 2024
NEoWave FORECASTING on S&P 500
Released by Glenn Neely on Monday, June 17, 2024.
NEoWave Logic:
Large Triangle (from black arrow)
The S&P's continuing rally reduces the odds wave-B is still forming and now favors it ended at the low in April. Wave-B can be this small only if it is part of contracting Triangle (with reverse alternation) or a NEoWave Symmetrical (2nd choice less likely due to time contraints).
NEoWave Analysis - WEEKLY Structure
Terminals and Triangles are structurally identical (the main difference is post-parttern behavior). So, it makes sense Triangles could experience the same extreme alternation seen in Terminals. Above, wave-B ended far sooner and higher than typical (making it impossible to predict). If wave-D retraces most of wave-C, and wave-E fails, then all the ingredients needed to form a contracting Triangle will be present.
For the latest NEoWave Forecasting on S&P 500 SUBSCRIBE TODAY
CHART 4
Released Wednesday, August 7, 2024
NEoWave FORECASTING on S&P 500
Released by Glenn Neely on Wednesday, August 7, 2024.
NEoWave Logic:
Contracting Triangle (from black arrow)
If a contracting Triangle began after
big wave-C, the diminutive size of wave-b requires wave-d be much larger and far more time-consuming (see blue-dashed forecast line). This suggests
the S&P will get very volatile into the U.S.'s 2024 Presidential election.
NEoWave Analysis - WEEKLY Structure
The main forecast last week was
"Before the end of August, wave-d is likely to become the largest decline of this year... wave-d should drop below the top wave-b..." Both forecasts came true during the massive sell-off of the last 2 trading days! Because wave-b is so small, I can't predict whether wave-d will break the low of wave-b or conclude above it to start wave-e. Either way,
wave-e will top below wave-c.
For the latest NEoWave Forecasting on S&P 500 SUBSCRIBE TODAY
Connect with Glenn Neely:
https://www.facebook.com/NEoWaveGlennNeely
https://www.linkedin.com/in/glenn-neely
Follow us @NEoWaveTheory:
https://www.facebook.com/NEoWaveTheory
https://www.instagram.com/NEoWaveTheory
https://twitter.com/NEoWaveTheory
https://www.linkedin.com/company/neowave-inc
https://www.youtube.com/neowaveinc
