Free Resources / NEELY RIVER Explained / Why is it called Neely River?
Why is it called Neely River?
by Glenn Neely, founder of NEoWave and Neely River Trading technology
Why markets are like rivers – a surprising insight that can help you become a better trader using Neely River theory
Why are markets like rivers? When it comes to comparing markets to the movement of water, it's helpful to look at 2 types of environments:
- Rivers – Most of the water is flowing in a dominant direction. The water near the banks tends to be turbulent and choppy, and the water in the middle tends to move quickly.
- Lakes – While the water is moving, there is no dominant direction.
Understanding the forces at work in a river
Let's say that you're standing next to a lake, and you have five tennis balls in your hands. You throw them up in the air, you freeze time for a minute, and you get the world's most advanced supercomputer to calculate the speed and angle of each ball, the wind direction, and the lake's currents. Your goal is to try to figure out where each tennis ball will end up 15 minutes after it hits the water. Due to all the random factors involved in this activity, there's virtually no way to know where each ball will end up – no matter how sophisticated the computer system. The lake environment produces a lot of randomness that we can't deal with very well.
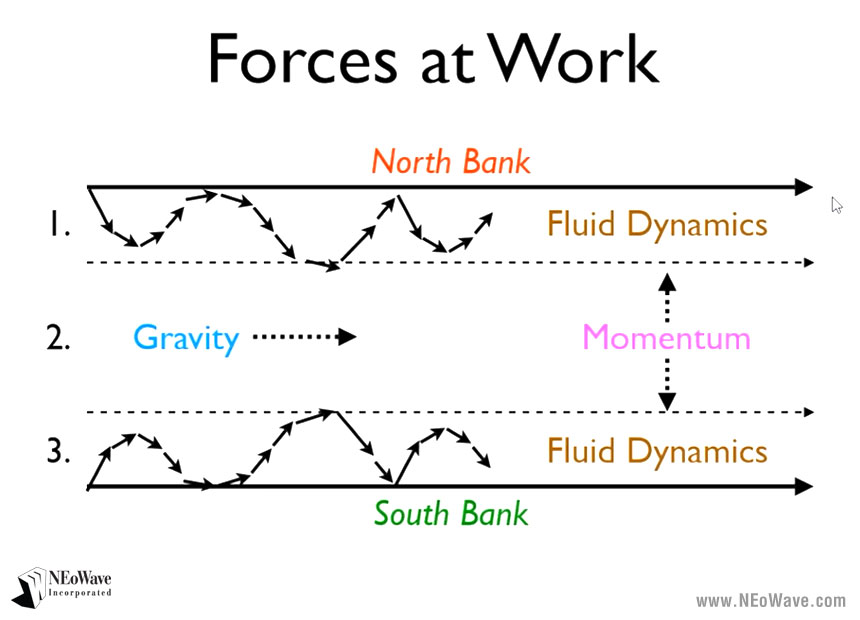
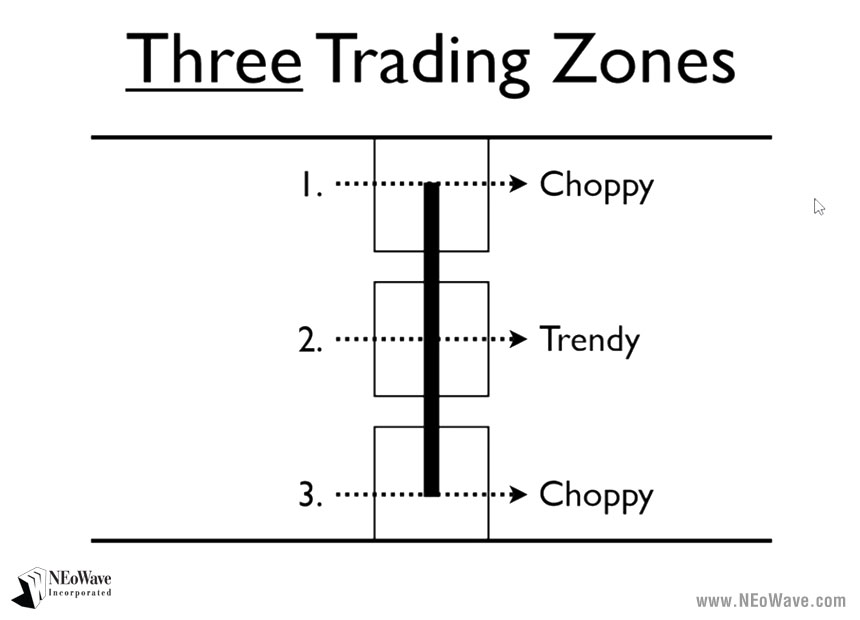
Suddenly, the lake's east bank is breached! The water breaks through the bank and starts flowing like a river. (Gravity, of course, is the force that gets it moving.) The flowing water creates turbulence as the water rubs against the lake's north and south banks. The water in the middle of the lake, unencumbered, moves the fastest. This creates three zones of behavior in our lake: turbulence at the "top" and "bottom" (the north and south banks) and more directional action near the center.
Understanding the forces at work in markets
Markets can exhibit similar kinds of behavior. You can have dead market action with a bit of random behavior and no trending action. Or perhaps a newsworthy event occurs, and markets can zoom up or zoom down. Various opposing forces – lots of different things – can come into play, and you may not be able to predict what's going to happen.
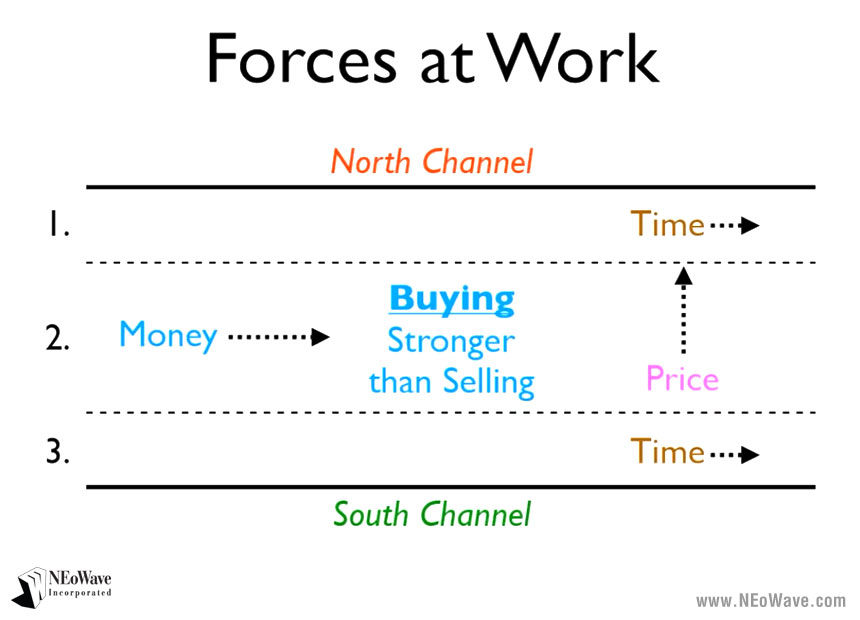
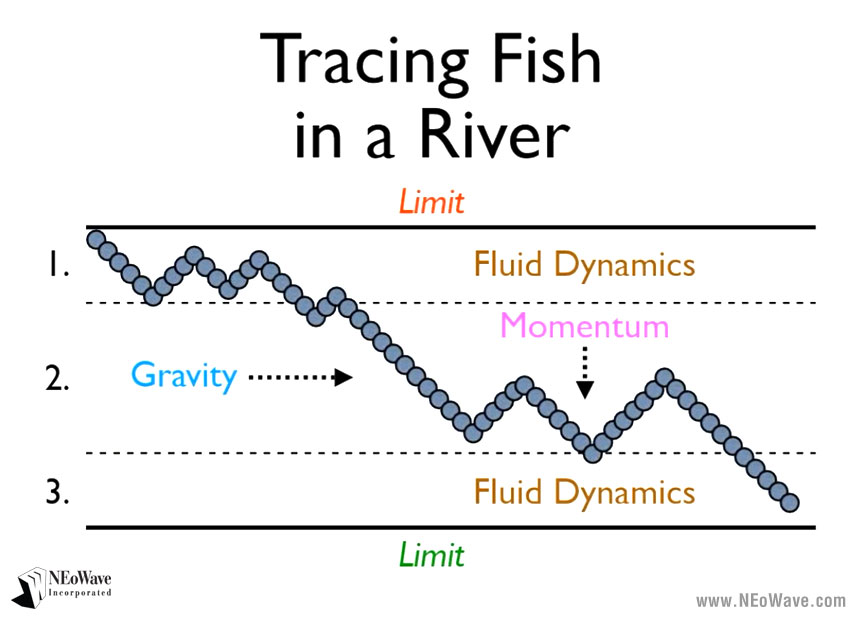
In a river, gravity is the force. In markets, money is the force.
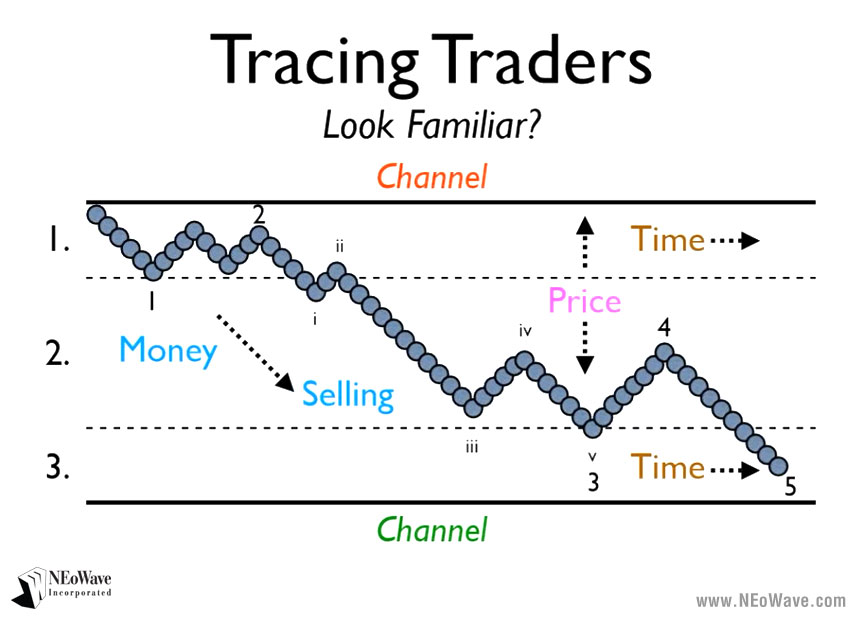
As money flows into a market, it will tend to push prices higher. As money flows out of a market, prices will move lower. (Obviously, with a market environment, there's only one direction you can go on a chart, which is to the right, because time constantly progresses.) The process is not perfectly smooth, of course. As money flows in, prices will zigzag up. As the money comes out, prices will zigzag down.
The flowing of the market is similar to the behavior of a river.
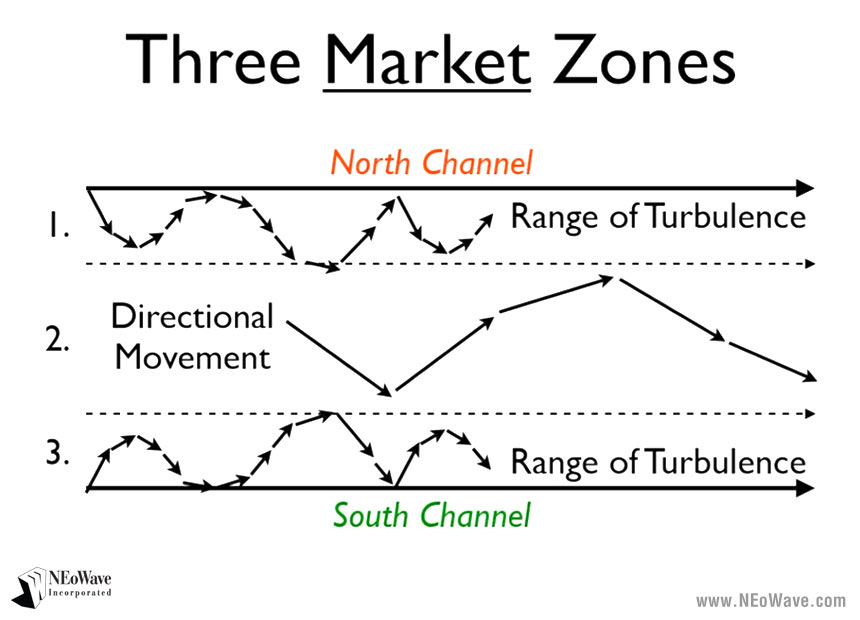
During that flowing-in and flowing-out process in a market, you'll see similar kinds of behavior as in a river. As the market advances – goes up or sideways or down – you'll have zones of turbulence that take place near the top and bottom ranges (or channels), and you'll have more directional price action near the middle. (When I teach Neely River Trading technology in my Professional Trading Course, I show traders how to objectively draw these channels.)
In short, the trading behavior you can generally expect in a market includes choppy behavior near the top and bottom of a range (or channel) and trending behavior near the middle.
Tracing fish in a river is similar to tracing market actions
Now let's say that you're standing at the edge of a river, and you place a tennis ball in the water. Obviously, it's not going to travel in a straight line. Thanks to fluid dynamics, it's going to chop around and get caught in the turbulence. Eventually, it's likely to break beyond what I call the event horizon, which is generally about 25% between the north and south bank of the river (refer to the orange limit line and green limit line in the "tracing fish in a river" graphic). After the tennis ball passes that point, it starts to accelerate.
Markets generally fall into two main categories: You have either trending markets or dead markets.
- When they are trending, they will behave in certain ways – they are generally fast-moving like a swift current.
- When they are not trending, their behavior is generally choppy and turbulent.
When I realized this phenomenon – specifically, how market action mirrored river action – this put me on the path to develop Neely River Trading technology. It was almost a eureka kind of moment for me. I started to realize that I was onto something because of this connection.
How does Neely River Trading work in the real world?
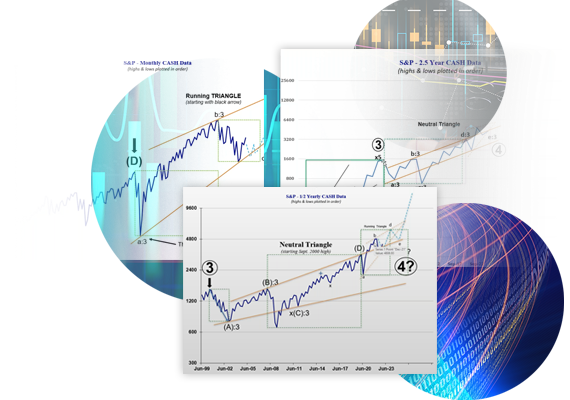
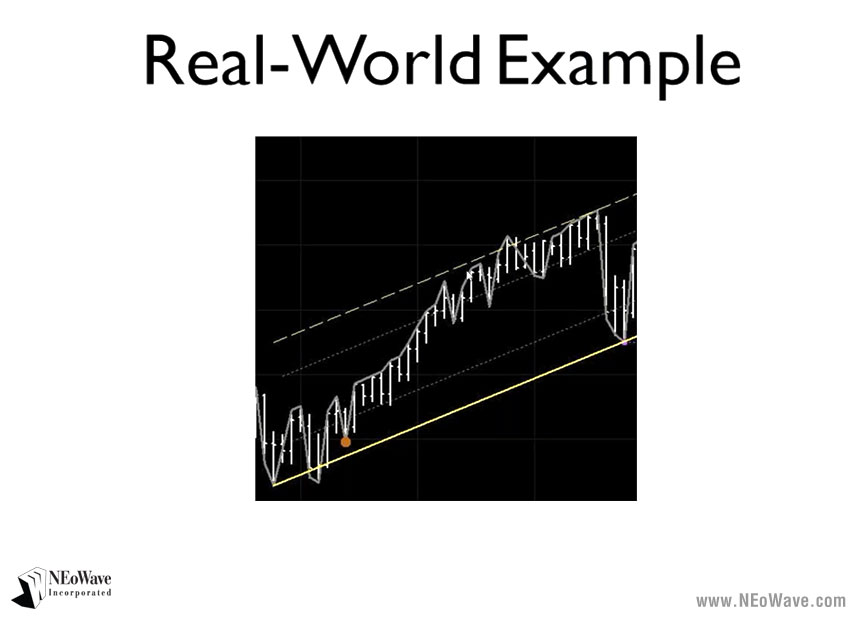
Let's take a look at a real-world example, so you can see the behavior I'm talking about. Keep in mind that no channel is going to be perfectly horizontal, because they can go up, down, or sideways. They can expand or contract. But the fundamental behavior remains the same, as long as you know how to draw the channels.
In this case, the channel was going up at about a 45-degree angle. And you can see the choppiness that took place near the bottom-left of the channel, then it started to accelerate in the middle, then it started to chop up at the upper end of the range (top of chart). Most people wouldn't consider this to be choppy or turbulent action, because it's continuing to go up. But when the channel is placed properly, you can see – from a river perspective – that the top is the turbulent zone. So is the bottom-left. The middle area is the acceleration zone. Then the price dropped quickly (far-right portion of chart) and started chopping around again a bit more.
The connection between river behavior and market behavior is there – if you know where to look!
This short article gives you an idea of the connection between river behavior and market behavior. This is a quick, general overview. To learn more, take advantage of our free resources to gain a deeper understanding of Neely River Trading technology – and how it can help you become a better trader.
(Read "Is there a Neely River Trading course or software?" to learn more on Neely River Trading courses.)