NEoWave News
September 12, 2012
News: NEOWAVE'S GLENN NEELY SHARES TECHNIQUES TO IMPROVE WAVE ANALYSIS
Educational Interview Provides Instructions for Novice and Advanced Analysts to Improve Wave Forecasts
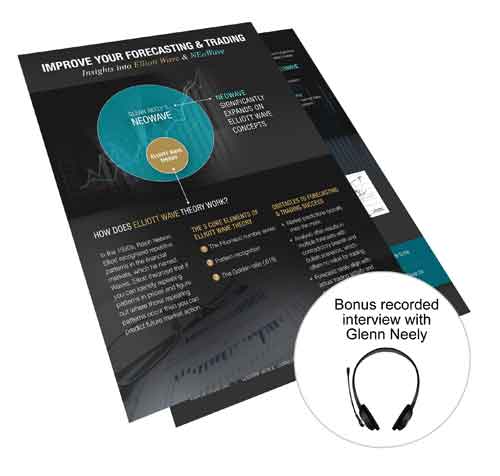
September 12, 2012 - In a new audio interview - "Creating Proper Charts for Accurate Wave Forecasts" - Glenn Neely, founder of NEoWave, Inc. and an internationally respected Wave analyst, shares specific tips and insight to guide Elliott Wave analysts, both novice and experienced, to improve their forecasting.
In this 30-minute audio interview, Glenn Neely discusses the pros and cons of using line charts, bar charts, and Wave charts for Elliott Wave and NEoWave forecasting. In addition, he explains why Cash data - with daily highs and lows plotted in the order they occurred in real time - presents a more accurate picture of market behavior and lays the foundation for more accurate Wave forecasting. Click to hear the recording, read the transcript, and view example charts of Glenn Neely's interview: "Creating Proper Charts for Accurate Wave Forecasts."
"To improve their Wave forecasting, I encourage Elliott Wave analysts to use Wave charts with Cash data," Neely says. "Charting cash-data highs and lows for 20 years, by hand, was an extremely time-consuming process. As technology improved, I realized this tedious work could be done by computer. That's when I hired world-class programmers to develop an automated process to collect and properly plot cash data," Neely explains. "The initial intent was to save time and create Wave charts that provided more precise forecasting. When my Forecasting service clients asked where I got such great cash charts, I realized others could benefit from them. So I went back to the drawing board to make my ‘in-house' data-collection process a professional service that could be used by Wave theory enthusiasts to improve their own Wave forecasts."
About Glenn Neely and NEoWave Institute
Glenn Neely, internationally regarded as the premier
Elliott Wave analyst and trading expert, has devoted nearly 30 years to refining, mastering, and advancing the concepts of
Wave theory to make it scientific, objective, and logical. Glenn Neely's now-famous NEoWave technology is a precise, step-by-step assessment of market structure, which leads to more accurate Wave analysis, as well as low-risk investing and trading with demonstrated returns. Analysts, professional investors, and traders worldwide trust NEoWave's Trading and Forecasting services for market forecasting and wise trading advice on the S&P, Euro, T-Notes, and Gold markets.
Learn more about Glenn Neely and the NEoWave, Inc. at
https://www.NEoWave.com
Learn about
NEoWave's Forecasting Service.
Learn about
NEoWave's Trading Service.


