Education / NEoWave Explained / Rule of Reverse Logic
How to use the NEoWave Rule of Reverse Logic in Your Analysis
by Glenn Neely
Editor's Note: In this instructional article, Glenn Neely explains NEoWave's Rule of Reverse Logic.
This exceptionally useful Wave Theory forecasting technique – using Middle Markings – enables you to keep your counts on track.
This article follows his March 2023 webinar, titled "Bitcoin's Shocking Future."
Webinar participants watched, in real-time, as Mr. Neely evaluated his 16 different wave charts presenting conflicting bullish and bearish counts,
applied his Rule of Reverse Logic to critique and cull the counts, and identified the ONE most likely scenario for Bitcoin's future.
Click here to watch this webinar ($19).
Learn how to use the NEoWave Rule of Reverse Logic as an effective technique to evaluate conflicting bearish or bullish scenarios to keep your counts on track.
Have you ever arrived at conflicting wave counts? It's common!
If you conduct Wave Forecasting, you know it's not unusual to arrive at conflicting bullish and bearish forecasts.
But this situation begs two questions:
How do you select the the ONE most likely scenario?
How can you be confident in that final scenario, so you can trade that market?
Fortunately, there's a way to manage this challenge: Use NEoWave's Rule of Reverse Logic.
I will discuss this extremely useful technique in detail in the following paragraphs.
In early 2023, I presented an in-depth webinar showing how I arrived at Bitcoin's long-term forecast using NEoWave (advanced Elliott Wave).
In that live webinar, hundreds of attendees watched in real-time as I evaluated multiple wave counts – some bullish, some bearish – to determine the most probable long-term forecast for Bitcoin.
This exceptionally useful Wave Theory forecasting technique – using Middle Markings – enables you to keep your counts on track.
In the webinar, I reviewed my 16 different counts, eliminated the wave charts that had structural issues, and culled to the point of having ONE solid forecast.
I could then confidently announce what was, to me, a shocking long-term scenario for the world's largest cryptocurrency:
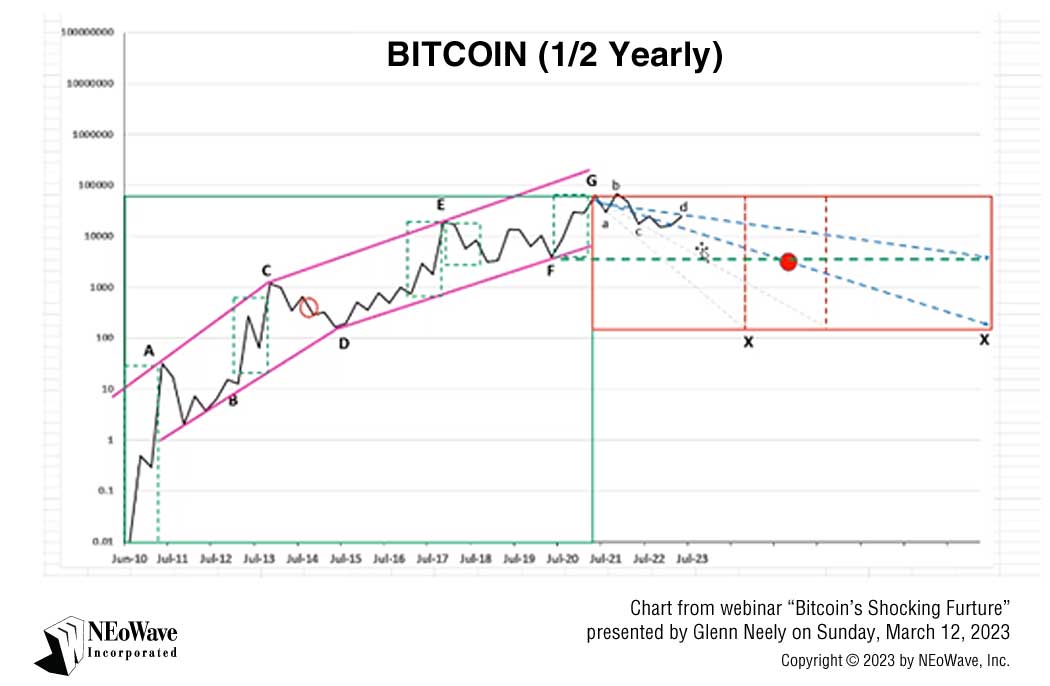
Bitcoin appears to be in for a multiyear downward trend!
You can see this downward trend on my "Bitcoin 1/2 Yearly" chart.
Plus, you can watch my webinar to hear more details about my shocking – and admittedly controversial – forecast for Bitcoin's future.
Click here to watch this webinar ($19).
Due to Bitcoin's complex wave patterns, I came up with multiple wave counts.
Let's step back just a bit. I avoided doing Wave analysis on Bitcoin for years, because the structure was extremely complicated. Until fairly recently, it seemed almost impossible to figure out. I actually wondered if Bitcoin would not follow Wave Theory. I wondered if it was one of the rare markets that simply would not adhere to Wave Theory concepts.
This nagging thought was somewhat surprising to me. When I first heard about cryptocurrency I thought this could be the best market in the world for Wave Theory,
because it was manmade and purely psychological. However, from a Wave Forecasting standpoint, this market had been mercurial. I could not figure out what was going on.
In the last year or two, evidence started to emerge that some complex, unusual wave patterns were developing. Due to Bitcoin's complex structure,
I came up with multiple wave count possibilities. In fact, I came up with more than 16 scenarios for four different timeframes:
- Half-yearly (six-monthly)
- Monthly
- Weekly
- Daily
It's rare to have that many different counts, and it makes Wave Forecasting a lot more complicated. Worse, the counts contradicted each other, because some were bullish, and some were bearish!
How to use NEoWave's Rule of Reverse Logic to keep your counts on track.
In order to arrive at the ONE most accurate count, I needed to apply the Rule of Reverse Logic, an extremely useful NEoWave technique I developed years ago.
(You can read about this in Chapter 12 of my book,
Mastering Elliott Wave.)
I've implemented this technique many times over the decades. I believe it's one of the most valuable concepts in my book, because this effective tool enables you to keep your counts on track.
In the Bitcoin webinar I presented in early 2023, I showed – in real time – how to apply the Rule of Reverse Logic to the 16 different wave charts I had developed. The first step is dividing the bullish and bearish scenarios into two groups.
Next, you will link all the best counts together from the half-yearly timeframe down to the monthly, weekly, and daily timeframes. It's important to begin with the longest timeframe and work your way down to the daily timeframe.
When you view the webinar, you'll see me apply the Rule of Reverse Logic and use something I call Middle Markings to home in on the best counts. For example, I started by evaluating a half-yearly bullish count. That particular wave chart showed a possible contracting triangle. However, the problem with this count is that the D-wave's low did not overlap the B-wave's high, and the pattern drifted up very strongly. Overlap is a crucial ingredient of good triangular development, so that was a major strike against this count. In fact, during the webinar, I typed these words on that chart: "Lack of overlap between waves-B and D is a major problem." In addition, the X-wave was unusually small. Given the structural issues of this bullish scenario for Bitcoin, I removed this scenario from consideration.
Looking at another six-monthly count, I critiqued this chart's bullish scenario, which featured a zigzag pattern and contracting triangle. I commented on waves-A, B, and C and noted the X-wave's drift upward, which would suggest a lot of power when the X-wave concludes – and that would explain the violent rally depicted on this chart. I found no structural issues with this count and put it aside for later consideration.
Webinar participants watched as I evaluated the merits of each of the 16 counts, working from the longest timeframe (six-monthly) to the shortest timeframe (daily). In the process, I discussed contracting triangles, expanding triangles, diametricals, symmetricals, monowaves, and other Elliott Wave and NEoWave patterns. I removed any counts with structural issues and retained those that seemed plausible. Also, keep in mind that the counts you retain must follow NEoWave rules.
This high-level review of each count was an important foundational step. During the process of reviewing the 16 Bitcoin forecasts, I ended up eliminating all the bullish counts, which left only the bearish possibilities.
Next, webinar participants watched as I applied the Rule of Reverse Logic to identify a single good count for each of the four timeframes. Remember, whenever you have two or more scenarios, you will want to use this rule.
There are three key points to the Rule of Reverse Logic: You will end up selecting the count that (1) is closest to the center, (2) takes the longest to finish, and (3) is the most boring. Yes, you read that right! You will end up with the least exciting count – the one that produces the least eventful outcome.
In the webinar, I marked the middle of the structure for each chart with a red dot (this is my Middle Marking technique). Next, I took a closer look at the remaining six-monthly charts – the longest timeframe – and identified the single chart that followed the above three points and, of course, followed all the NEoWave rules. Interestingly, this bearish scenario revealed a challenging future for Bitcoin, with many years of going sideways or down.
My next step in using the Rule of Reverse Logic was to link the six-monthly timeframe to the monthly timeframe. I looked through the various monthly counts and, using the process of elimination, I selected the count that aligned with the three key points mentioned above, had no structural problems, and fit the long-term structure the best. Of course, this monthly wave chart presented a bearish scenario. As I stated in my webinar, this count finished the G-wave at the earlier high, created a nicely designed diametric that contracts and expands slightly, and presented five waves similar in time.
Next, I identified the only weekly chart that fit both the six-monthly and monthly charts, met the three-point criteria, and followed all the rules. Finally, I did the same thing with the daily timeframe. This left only one daily count, where wave-G was at the low, wave-A finished at the high, and it appeared to have a contracting triangle with reverse alternation.
Combining all the scenarios together, beginning with the longest timeframe, it looks like – remarkably and unbelievably – that Bitcoin is going to be in a neutral or bear market for the next three to five years, maybe even seven years. To me, this was a shocking outcome, because I never expected to see such a bearish outlook. But the application of the Rule of Reverse Logic is forcing me into this direction.
Remember, good Wave analysis is not based on opinion, perception, or assumptions. It is based on following a rigid set of rules that forces you to accept conclusions that may be uncomfortable but that turn out to be correct. I know this from experience, as I have been conducting Wave analysis for 40 years.
Think of it this way: The Rule of Reverse Logic is like taking a cross-country trip.
I use this analogy in my Advanced Wave Analysis courses: Let's say you want to drive from California to New York City. You leave California and head east. Soon, you realize you have more and more choices of roads you can take. For example, you could end up driving through North Dakota, South Dakota, Nebraska, Kansas, Oklahoma, or Texas. Eventually, though, you'll work your way onto the ONE highway that leads to your specific destination in New York City.
When conducting Wave analysis, you will often have multiple scenarios that are contradictory, confusing, and obscure. It can be challenging to identify exactly where you are going. The Rule of Reverse Logic always works when you have multiple counts. As you get toward the end, you will get down to one count, and it becomes obvious what's going on.
I have used the Rule of Reverse Logic many, many times over the years and have found that it works 100% of the time. At the end of this process, all the alternate scenarios will disappear. You won't have five or ten counts – you will have just ONE good count.
Editor's Note: This article follows Glenn Neely's March 12, 2023 webinar, titled "Bitcoin's Shocking Future."
Webinar participants watched, in real-time, as Mr. Neely evaluated his 16 different wave charts presenting conflicting bullish and bearish counts,
applied his Rule of Reverse Logic to critique and cull the counts, and identified the ONE most likely scenario for Bitcoin's future.
The webinar is available for purchase.
Click here to watch this webinar ($19).
-
Neely, Glenn. Bitcoin's Shocking Future (NEoWave Analysis), 12 March 2023. Webinar.
-
Neely, Glenn; Hall, Eric (1990-04-01).
Mastering Elliott Wave: Presenting the Neely Method: The First Scientific, Objective Approach to Market Forecasting with the Elliott Wave Theory
(2nd ed.). Brightwaters, NY: Windsor Books. p. 1. ISBN 978-0-930233-44-0
NEOWAVE WEBINAR:
Bitcoin's Shocking Future
Presented by Glenn Neely on Sunday, March 12, 2023
Webinar participants watched, in real-time, as Mr. Neely evaluated his 16 different wave charts presenting conflicting bullish and bearish counts,
applied his Rule of Reverse Logic to critique and cull the counts,
and identified the ONE most likely scenario for Bitcoin's future.
watch this webinar ($19)