FREE TOOLS
Boost your Elliott Wave trading and forecasting with these 2 powerful – and simple – tools
Sign up now to get:
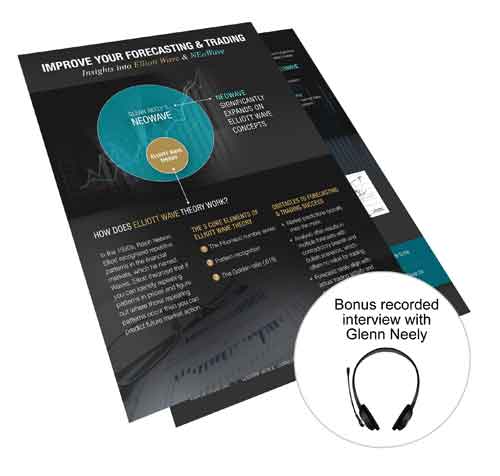
- INFOGRAPHIC: "Improve Your Forecasting and Trading: Insights into Elliott Wave & NEoWave"
- BONUS recorded interview with Glenn Neely: "Elliott Wave Forecasting: How to 'Crack the Code' & Improve Your Trading Results"
*No purchase obligation whatsoever. We do not sell or share our mailing list.