NEoWave Blog
11/19/2023 - NEoWave Staff
GLENN NEELY: 3 MAJOR Lows PREDICTED Since 2020
Using NEoWave, Glenn Neely has made many impressive financial forecasts over the last four decades. So it's no surprise, on this 40th anniversary of NEoWave, Mr. Neely has once again done the impossible. Using NEoWave, he forecasted for this year "the Hyper-Violent rally" that unfolded since October's low. The blog below is a review of major buying opportunities since 2020 forecasted by Glenn Neely, using NEoWave.
Written by Glenn Neely
Author of Mastering Elliott Wave, Financial Forecaster & Trading Advisor
Founder of NEoWave Inc.
REVIEW of Major BUYING OPPORTUNTIES Last 3 Years
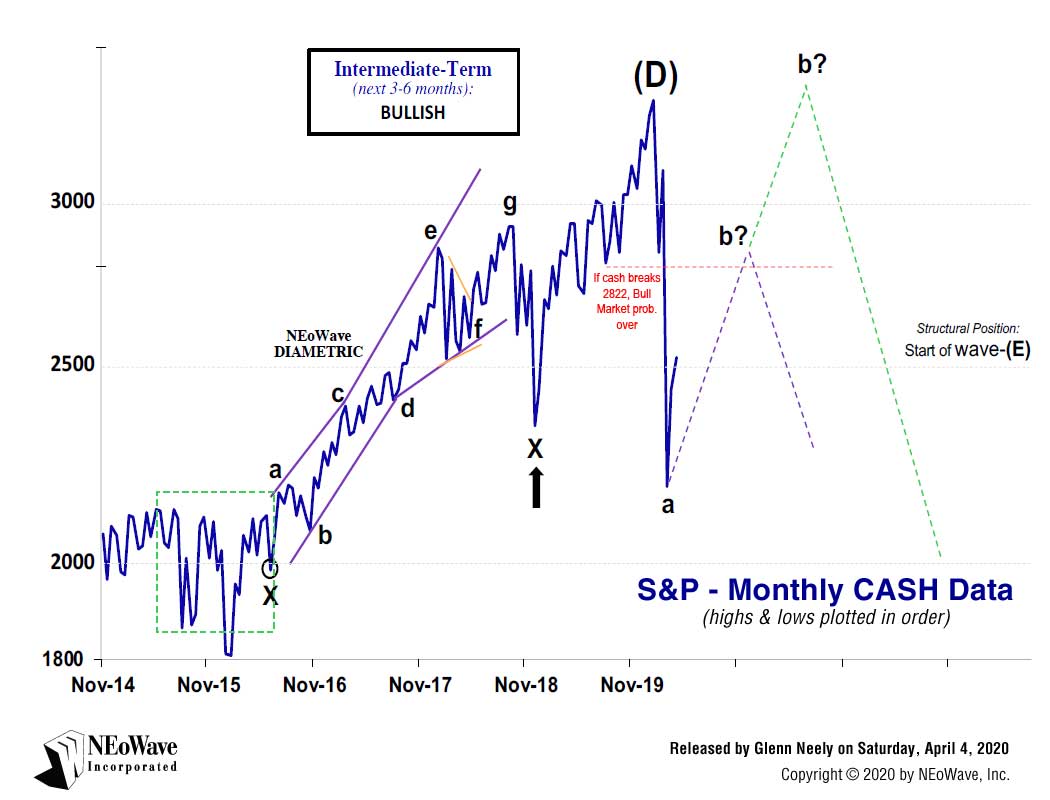
On April 4, 2020 (just a few weeks after the "Covid Crash Low"), I released the attached S&P Forecasting update (see green-line on CHART 1). Therein, I predicted the S&P could rally to all-time-new-highs in 1-2 years! I solidified that outlook 2 weeks later.
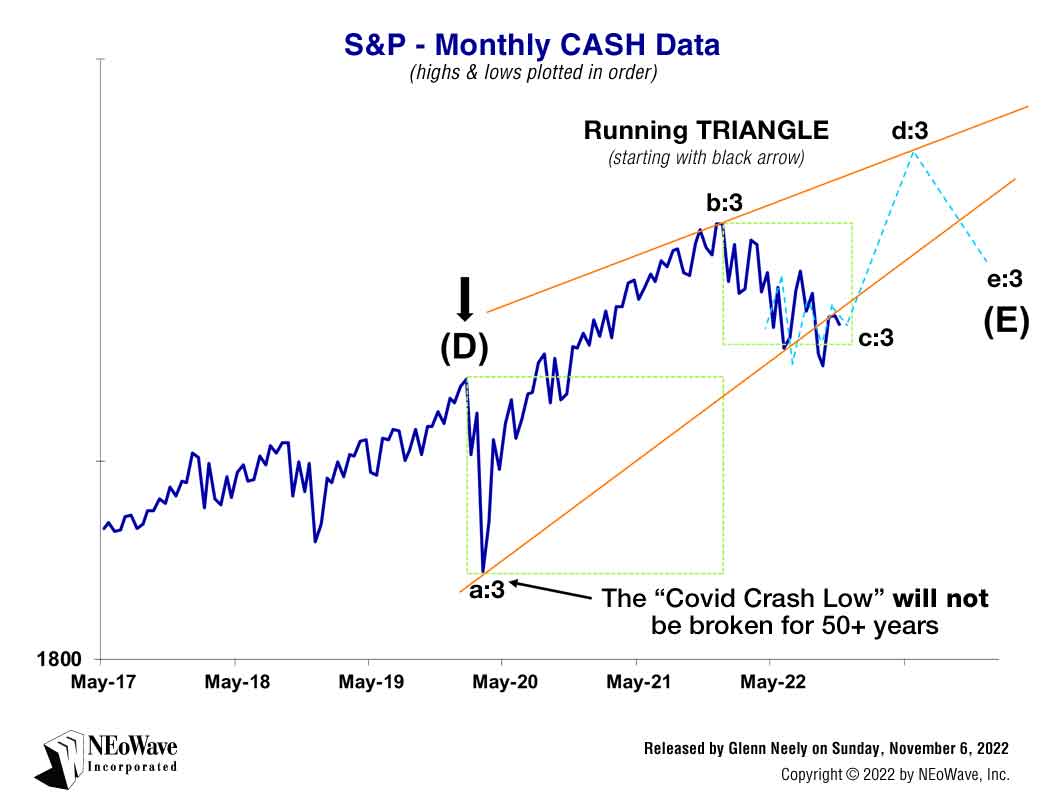
Then, on November 6, 2022, CHART 2 was released as part of the NEoWave S&P Forecasting service. There, I accurately predicted the S&P was making a major low and would reach new, historic highs in the next year or so (see blue-dashed line).
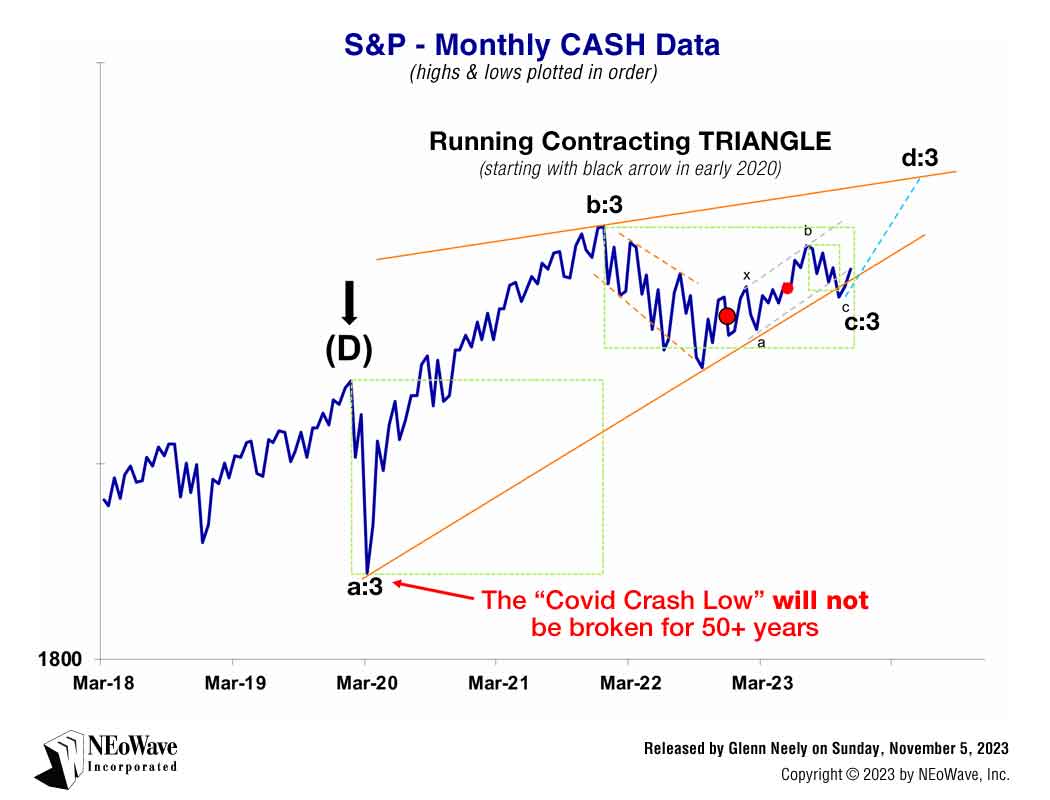
Finally, a year later, on November 5, 2023, CHART 3 was released, stating Phase 2 of the Bull Market (off the 2022 low) was getting underway.
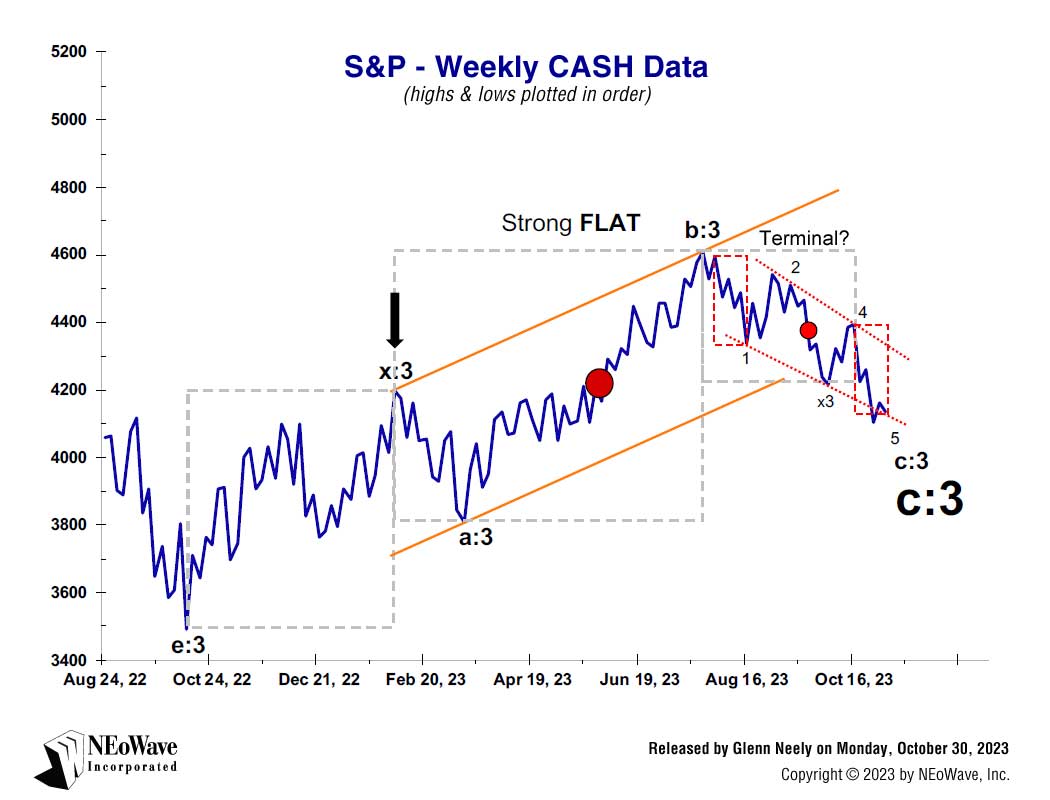
One day after last month's low, on October 30, 2023, subscribers to our S&P Forecasting service were warned "...a HYPER-VIOLENT rally will commence in the S&P into the end of 2023." You can see that forecast on CHART 4. The S&P rallied over 300 points (the Dow around 3000 points!) in less than 2 weeks! CHART 5 shows "the Hyper-Violent rally" that unfolded since October's low.
Such forecasting accuracy is IMPOSSIBLE with Orthodox Elliott Wave. NEoWave is the ONLY forecasting technology that provides you the rules and tools to predict markets with confidence, precision and specificity. If you want to dramatically improve your forecasting skills, make sure to Reserve Your Spot for the next NEoWave Advanced Wave Analysis classes, starting early 2023.
RESERVE YOUR SPOT on the next NEoWave Forecasting Course at:
https://www.neowave.com/AWA-COURSE/
Sincerely,
Glenn Neely
NEoWave, Inc.
www.NEoWave.com
CHART 1
Released Saturday, April 4, 2020
NEoWave FORECASTING on S&P 500
Released by Glenn Neely on Saturday, April 4, 2020.
NEoWave Logic:
Neutral Triangle? (from black arrow)
The cash S&P has "thrusted" out of the prior neutral Triangle exactly as the red-dashed link predicted. With the minimum upside target met, and last week's substantial sell-off, it's likely wave-c of a Triangle or Diametric just ended. Wave-d is probably underway (see red-lin).
NEoWave Analysis - WEEKLY Structure
Early last month, I provided 2 scenarios. The first was a prolonged consolidation
if cash held above 2822. The other said if cash broke 2822 the
"...11-year bull market is over..." Unfortunately, the Corona Virus pandemic forced wave-(D) to end a few months sooner than expected; now, we are left dealing with its impact. March's low appears to be wave-a of an expanding (green) or contracting (purple) Triangle.
For the latest NEoWave Forecasting on S&P 500 SUBSCRIBE TODAY
CHART 2
Released Sunday, November 6, 2022
NEoWave FORECASTING on S&P 500
Released by Glenn Neely on Sunday, November 6, 2022.
NEoWave Logic:
Contracting Triangle (from black arrow)
The firest green box measures the price of wave-a and the combined times of a & b. The seond green box is 61.8% of wave-a's price and half the total time of waves-a & b. IF a contracting Triangle is forming, wave-c will end soon above the low made in October.
NEoWave Analysis - WEEKLY Structure
As long as October's low is not broken, this contracting Triangle will remain our best choice. If correct, this bear market (unfolding all year) will end by or before late January. Afterward, a strong rally to all-time new highs will occur into mid or late 2023. On the other hand, if this October's low in broken, a final "scary, news driven" price collapse will take place into early 2023, which will then be followed a major advance.
For the latest NEoWave Forecasting on S&P 500 SUBSCRIBE TODAY
CHART 3
Released Sunday, November 5, 2023
NEoWave FORECASTING on S&P 500
Released by Glenn Neely on Sunday, November 5, 2023.
NEoWave Logic:
Contracting Triangle (from black arrow)
In Triangles, wave-d cannot break the a-c trendline. Because the orange trendline was broken last month, we must move wave-c from March to October's low. Last week's "hyper-violent" rally must be the start of wave-d.
NEoWave Analysis - WEEKLY Structure
Last week, I warned, if Diametrics are
not an exception to NEoWave confirmation rules, a
"...massive 'count reconstruction' will soon be required." That reconstruction begins today by moving the conclusion of wave-c from March's low to last week's low. The size and staggering speed of the recent 5-day rally virtually assures us wave-d began.
For the latest NEoWave Forecasting on S&P 500 SUBSCRIBE TODAY
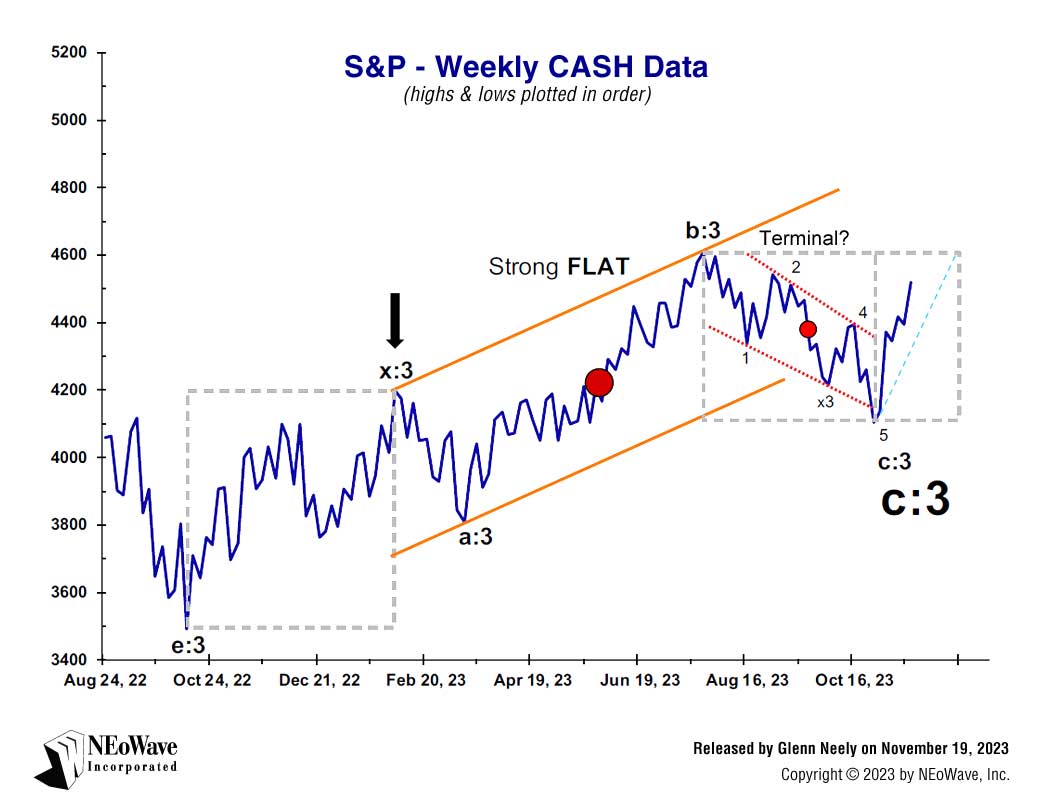
CHART 4
Released Monday, October 30, 2023
NEoWave FORECASTING on S&P 500
Released by Glenn Neely on Monday, October 30, 2023.
NEoWave Logic:
Strong FLAT (from black arrow)
A break of the long-term trendline (from March 2020 to October 2022 lows) tells us large wave-C did NOT end at the October 2022 low. That event foreces me to push the conclusion of large wave-C to the current time frame, which creates the avove
Flat ending with a Terminal C-wave.
NEoWave Analysis - WEEKLY Structure
At this juncture, wave-c could be a 3rd or 5th extension Terminal. Because the current Flat is strongly drifting upward, a 5th extension is less likely since it would contradict the signs of strength of the larger Flat by having a weak 5th wave. Therefore, until proven otherwise, I must presume wave-5 is almost complete. If so,
a HYPER-VIOLENT rally will commense in the S&P into the end of 2023.
For the latest NEoWave Forecasting on S&P 500 SUBSCRIBE TODAY
CHART 5
Released November 19, 2023
NEoWave FORECASTING on S&P 500
Released by Glenn Neely on November 19, 2023.
For the latest NEoWave Forecasting on S&P 500 SUBSCRIBE TODAY
NEoWave's ADVANCED WAVE ANALYSIS COURSE:
Learn to accurately predict markets in real time with Glenn Neely.
If you want to improve your forecasts, this is the best time in decades to learn Elliott Wave and NEoWave concepts in real-time. Take advantage of this exciting forecasting environment!
To learn more about NEoWave's Advanced Wave Analysis course, personally taught by Glenn Neely...
CLICK HERE
Connect with Glenn Neely:
https://www.facebook.com/NEoWaveGlennNeely
https://www.linkedin.com/in/glenn-neely
Follow us @NEoWaveTheory:
https://www.facebook.com/NEoWaveTheory
https://twitter.com/NEoWaveTheory
https://www.linkedin.com/company/neowave-inc