The Dow Hits 50,000! And Glenn Neely's Dow 100,000 Forecast is ON TRACK!
NEoWave Editor / 10 Minute Read
Intro note: For decades, Wave forecasting expert Glenn Neely, founder of NEoWave, has been resolute and steadfast about his SUPER-BULLISH long-term forecast for the US stock market, never shying away from his optimistic prediction. Meanwhile, the orthodox Elliott Wave camp maintains their decades-long BEARISH outlook as they persistently predict a doom-and-gloom collapse of the markets.
Here is an exciting update on this topic on this celebratory day for the US stock market, with the Dow Jones surging past the 50,000 mark. The following paragraphs present detailed background about Glenn Neely's 72-year, incredibly Bullish forecast for the Dow Jones, now known as his "Dow 100k" forecast. As Glenn Neely noted today, "The Dow only has to double one more time to make it to my target - after doubling FIVE times since I published my forecast in 1988."
An additional note: In a 1995 workshop (the link to the video is below) - when the Dow was hovering at a mere 5,000 points - Glenn Neely stated that the Dow would reach the "astounding" level of 50,000 and continue pushing ever higher. This was a goal that the workshop attendees, and most traders and Elliott Wave forecasters, considered to be impossible at the time!
For many people, this is an unbelievable milestone.
But not for the Wave forecaster who is "super-Bullish": Glenn Neely.
These stock market all-time highs continue to surprise many Wave forecasters, especially those in the orthodox (traditional) Elliott Wave camp. However, Glenn Neely is NOT surprised. Many in the orthodox Elliott Wave crowd still cling to the idea that the markets will tumble down, down, down. While markets certainly do move up and down, Glenn Neely's super-Bullish NEoWave forecasts predict a continued, long-term upward trend. The continued accuracy of his astonishing, 72-year, long-term forecast is proof that NEoWave (advanced Elliott Wave) has a far more accurate track record than orthodox Elliott Wave.
Glenn Neely's "Dow 100k" forecast may be the longest stock market prediction ever published.
In 1988, Mr. Neely published a brazen 72-year Wave forecast predicting the US stock market would continually and exponentially escalate in the coming decades. His Wave forecast predicted that by year 2060, the Dow Jones Industrial Average would exceed 100,000. Glenn Neely's forecast has become known as "Dow 100k." Today's exciting "Dow 50k" milestone indicates that his astounding long-term forecast is still on track!
Now, after 38 years, it appears this 72-year Dow Jones market forecast may be the most accurate long-term forecast ever published!
Mr. Neely points out that he published his long-term Dow forecast in 1988. When he recorded his video workshop in 1995, the Dow had not yet reached 5,000! (See the video below.)
"At the time, I was calling for a massive Bull market, projecting the Dow to get to 30,000 and then 40,000, and even higher over many years, and we are there now."
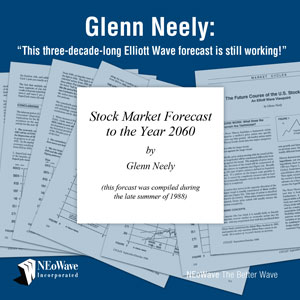
He says, "This nearly four-decade-long NEoWave forecast is still working!"
Glenn Neely adds: "It's interesting to note that orthodox (traditional) Elliott Wave forecasters have basically been proclaiming 'end of the world' bear markets for nearly every one of the last thirty years. My long-term, super-Bullish outlook is a HUGE differentiator between NEoWave and the orthodox crowd. Currently, the Dow is exactly halfway through the longest vertical price advance drawn on the chart that I included in my 1988 forecast."
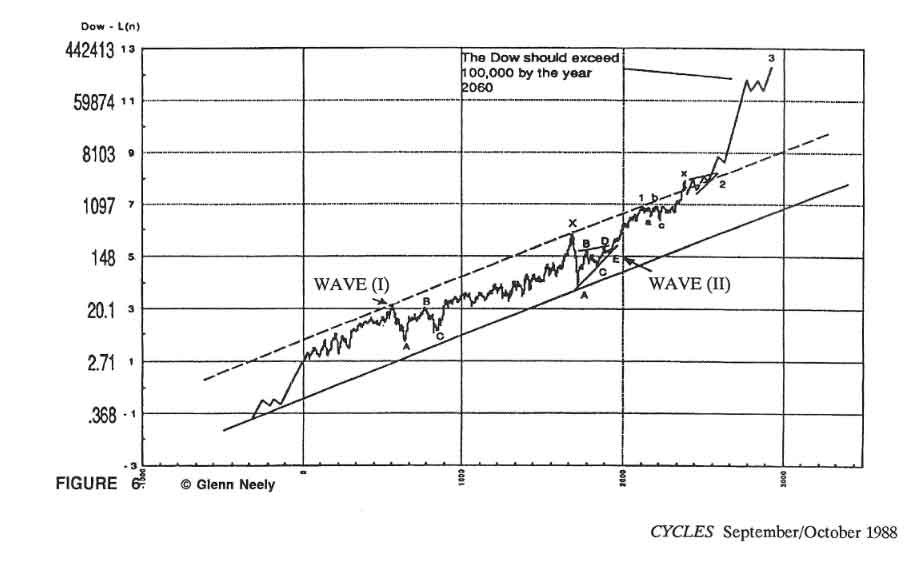
Glenn Neely published an article in 1988 presenting his 72-year Wave forecast
He wrote in 1988, "This advance should last for decades, creating the biggest Bull market of all time (see Figure 6)." The graph below shows the market as he predicted decades ago.
HEADS-UP WAVE FORECASTERS:
Watch as a decades-long SHOWDOWN unfolds between NEoWave and the orthodox Elliott Wave camp!
Here's the exciting situation that is unfolding: For decades, Glenn Neely has published super-Bullish forecasts for the US stock market (including his "Dow 100k" forecast). Meanwhile, the orthodox Elliott Wave camp seems to believe the US stock market is at the tail end of a 100- to 200-year-long Bull market and will begin hurtling downward, like a speeding train, toward a 1929-style crash.
"But they will be wrong!" says Glenn Neely. "The bearishness and pessimism will deteriorate in the next 2-3 years while the stock market keeps correcting AND recovering to new highs." He explains that his NEoWave forecasts consistently tell him that sometime in the next 2-3 years the stock market will begin its largest, most persistent, and incredibly powerful BULL MARKET OF ALL TIME into the year 2060!
The Ultimate Battle of the Bull vs. Bear!
This is a showdown in the truest sense of the word as two Wave philosophies will be put to the test in the next 2-3 years! Mr. Neely states that he "firmly believe the orthodox Elliott Wave camp's long-term, gloom-and-doom Bearish outlook will be proven wrong, and NEoWave's long-term, super-Bullish outlook will be proven right."
He adds: "I predict the US stock market will reach a point where it will EXPLODE upward. Meanwhile, the orthodox Elliott Wave crowd will be predicting a COLLAPSE of epic proportions."
Watch for updates as this Wave Forecasting SHOWDOWN OF THE CENTURY unfolds!
Neely, Glenn; Hall, Eric (1990-04-01). Mastering Elliott Wave: Presenting the Neely Method: The First Scientific, Objective Approach to Market Forecasting with the Elliott Wave Theory (2nd ed.). Brightwaters, NY: Windsor Books. p. 1. ISBN 978-0-930233-44-0
Read Glenn Neely's original article presenting his "Dow 100k" forecast, written and published in 1988
Read Mr. Neely's article, titled "The Future Course of the U.S. Stock Market: An Elliott Wave Viewpoint," which steps through his 72-year stock market forecast. When you read the article, you can track the Dow's progress from 1988 to present day, along with Mr. Neely's forecast all the way to 2060.
Watch a brief video of Mr. Neely explaining his "Dow 100k" forecast
In this 10-minute video workshop, Glenn Neely explains his long-term forecast. In 1995 - when the Dow was below 5,000 - Mr. Neely presented a workshop where he stepped through the reasoning behind his long-term (72-year) forecast. He shows his chart and explains his reasoning behind his forecast, which predicts the Dow would reach 100,000 by 2060. His incredible (and accurate) long-term forecast has become known as "Dow 100k." Thankfully, this workshop was recorded, and you can watch the video! In this video, he notes that the Dow would reach the "astounding" level of 50,000 and even higher - a goal that most traders and Elliott Wave forecasters considered to be impossible at the time!
Highlights from Glenn Neely's 1995 video (when the Dow was below 5,000):
Mr. Neely starts by showing the Wave structure for the entire history of the U.S. stock market, pointing out the long-term growth trajectory.
He explains that his long-term (72-year) forecast - published in 1988 - indicates the stock market will continue to progress and advance for decades, going into about 2060.
In this video, Glenn Neely says,
"The future force - or power - of the market is so great that the correction is stretched upward ... an upward drift that concludes a huge double-three-running second Wave correction [that began] in 1949. The market began its largest, most powerful, persistent advance in the history of the United States. ... What does that tell you? It tells you the market isn't slowing down. We're moving into a period of increasing momentum. [As a reminder, the Dow was below 5,000 at the time of this 1995 video.] ... Eventually, on a long scale, we're talking about the Dow going up to 10,000, 20,000, 30,000, 40,000, or 50,000 over about 60 years. This sounds outrageous to a lot of people. ... When you think of it in terms of historical logarithmic percentages, it's very plausible. ... This is extremely possible."